Gold Price Forecast: XAU/USD eyes $1750 after rejection at 200-DMA, focus on yields
- Gold price licks wounds amid firmer yields and US dollar.
- China slowdown worries help put a floor under gold price.
- Gold price remains vulnerable, with a test of $1750 on the cards.

On Friday, gold price tumbled nearly $30 and reversed its mid-week surge after facing strong rejection at the critical 200-Daily Moving Average (DMA), then at $1796. Despite the meltdown, gold price ended the week higher by 0.56%, underpinned by the looming China Evergrande risks and global stagflation worries.
A positive surprise delivered by the US Retail Sales on Friday sparked a rebound in the US Treasury yields across the curve, which lifted the dollar at the expense of the non-yielding gold price. US Retail Sales unexpectedly increased by 0.7% MoM in September vs. -0.2% expected. Rising consumer spending points to higher inflationary pressures, in turn, calling for Fed’s monetary policy normalization, as a November tapering is already priced-in by the markets. Upbeat US data drove the Wall Street indices higher, exerting additional downside pressure on the safe-haven gold.
This Monday, amid a quiet start to a busy week, gold price is licking its wounds around $1770, finding some support from the resurfacing China slowdown worries after the country’s GDP rate hit yearly lows at 4.9% YoY in Q3. However, the rising inflationary concerns-led earlier Fed’s tightening calls keep the buoyant tone intact around the Treasury yields, which limits the upside attempts in gold price. The benchmark 10-year Treasury yields have recaptured 1.60%, up nearly 2% so far.
Looking ahead, the dynamics in the yields and dollar will continue to be closely followed by gold traders amid the hawkish Fed’s expectations while the energy prices keep rallying. On the macroeconomic front, the US Industrial Production data and Fed official Quarles speech will offer some trading incentives.
Gold Price Chart - Technical outlook
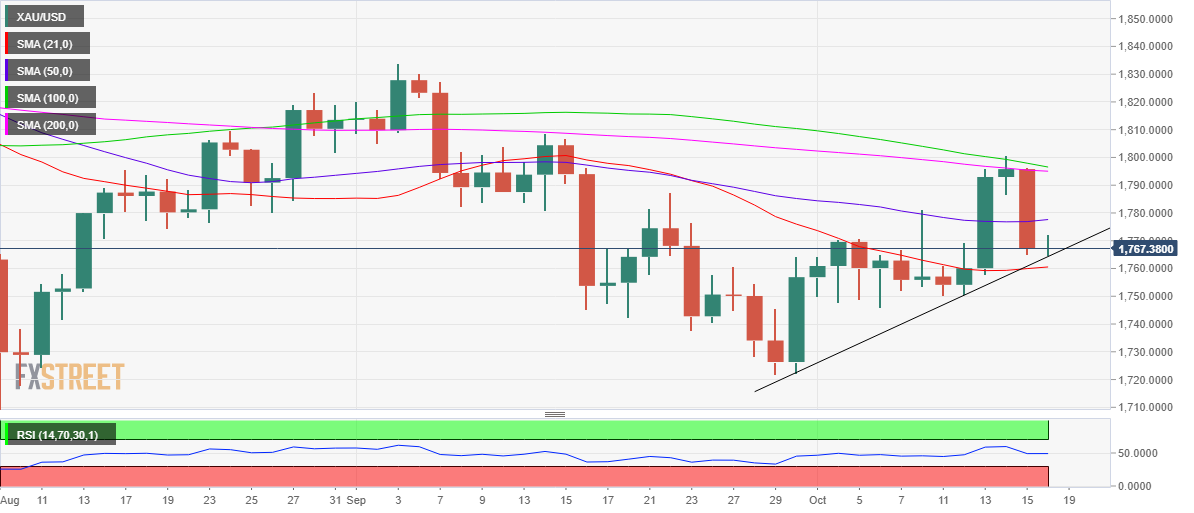
Gold: Daily chart
Gold price is pressuring lows near $1765, at the time of writing, as it tests the critical rising trendline support.
Gold price is looking to extend Friday’s decline towards the horizontal 21-DMA support at $1761. A sustained break below the latter could bring the last week’s demand area at $1750-$1745 back into play. Further south, the multi-week lows of $1722 could be on the sellers’ radars.
The 14-day Relative Strength Index (RSI) is trading flat just beneath the midline, suggesting that more downside could open up going forward. Adding credence to a potential move lower, the 100-DMA is on the verge of cutting the 200-DMA from above to confirm a bear cross.
On the flip side, gold bulls will need to recapture the 50-DMA at $1778 to revive the bullish interests. The next relevant target awaits at $1795, the confluence of the 100 and 200-DMAs. Buyers will then aim for the $1800 round number.
Author

Dhwani Mehta
FXStreet
Residing in Mumbai (India), Dhwani is a Senior Analyst and Manager of the Asian session at FXStreet. She has over 10 years of experience in analyzing and covering the global financial markets, with specialization in Forex and commodities markets.

















