Gold Price Forecast: A test of $2,030 remains on the cards amid stagflation fears – Confluence Detector
- Gold price retreats from multi-month highs above $2,000 amid a minor turnaround in risk sentiment.
- Rallying oil prices-led stagflation fears continue to underpin gold price, as the Russia-Ukraine war is far from over.
- Gold price needs a sustained move above $2,005 to unleash additional upside.

It indeed looks like a turnaround Tuesday, as the risk-on flows have returned on news that the European Union (EU) is reportedly considering massive joint bond sales to fund energy end defense spending. Although oil price continues its upsurge amid ongoing Russia-Ukraine conflict, underscoring stagflation risks as well as the demand for gold price. Gold price jumped beyond $2,000 to reach the highest level since August 2020, as the US remains on track to ban Russian oil imports without the participation of its allies.
Read: S&P 500 futures jump as EU may consider massive joint bond sales to fund energy, defense
Gold Price: Key levels to watch
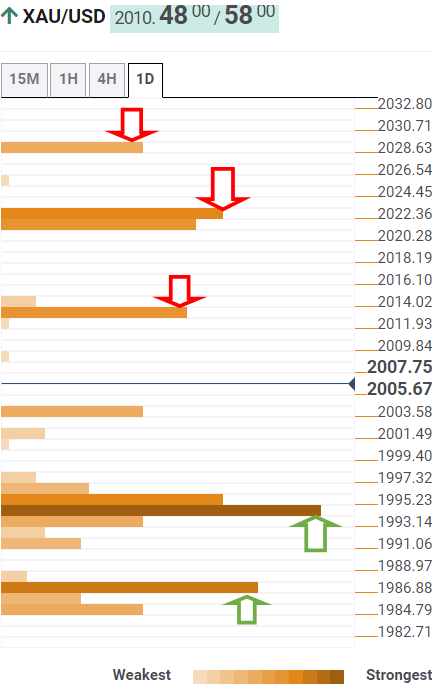
The Technical Confluences Detector shows that gold price retraced sharply after hitting the $2,022 strong hurdle on the upside.
That level is the convergence of the pivot point one-week R2, the previous high four-hour and the Bollinger Band four-hour Upper.
At the time of writing, the yellow metal remains supported above a dense cluster of healthy support levels around $1,996, where the pivot point one-month R1, pivot point one-week R1 and Fibonacci 23.6% one-day intersect.
Gold buyers need to recapture the pivot point one-day R1 at $2,012 to revive the bullish interest.
Once again, the critical $2,022 level will get tested, above which the pivot point one-day R2 at $2,030 will challenge the bearish commitments.
On the other side, if the $1,996 key support gives way, then sellers will target the SMA10 four-hour at $1,991.
Further south, the Fibonacci 38.2% one-day at $1,985 will come to the rescue of gold bulls.
Here is how it looks on the tool
About Technical Confluences Detector
The TCD (Technical Confluences Detector) is a tool to locate and point out those price levels where there is a congestion of indicators, moving averages, Fibonacci levels, Pivot Points, etc. If you are a short-term trader, you will find entry points for counter-trend strategies and hunt a few points at a time. If you are a medium-to-long-term trader, this tool will allow you to know in advance the price levels where a medium-to-long-term trend may stop and rest, where to unwind positions, or where to increase your position size.
Author

Dhwani Mehta
FXStreet
Residing in Mumbai (India), Dhwani is a Senior Analyst and Manager of the Asian session at FXStreet. She has over 10 years of experience in analyzing and covering the global financial markets, with specialization in Forex and commodities markets.


