Gold Price Forecast: $1,857 appears a tough nut to crack for XAUUSD bulls – Confluence Detector
- Gold Price remains at the mercy of the USD and Treasury yields.
- Risk sentiment and end of the week flows could also affect XAUUSD.
- The path of least resistance appears to the upside for the bright metal.

Global central banks showcased their resolve to tackle the inflation monster this week, with the Fed and SNB going in for bigger rate hikes, re-kindling recession fears. Risk-sensitive assets were heavily thrashed while the safe haven also failed to capitalize on the sour market mood, as long-dated US Treasury yields fell sharply. The sell-off in the dollar, helped gold price extend the post-Fed turnaround. The same underlying narrative is likely to remain in play going forward, as the yellow metal’s fate hinges on the dynamics of the dollar, as well as, the yields.
Also read: Is a recession now inevitable?
Gold Price: Key levels to watch
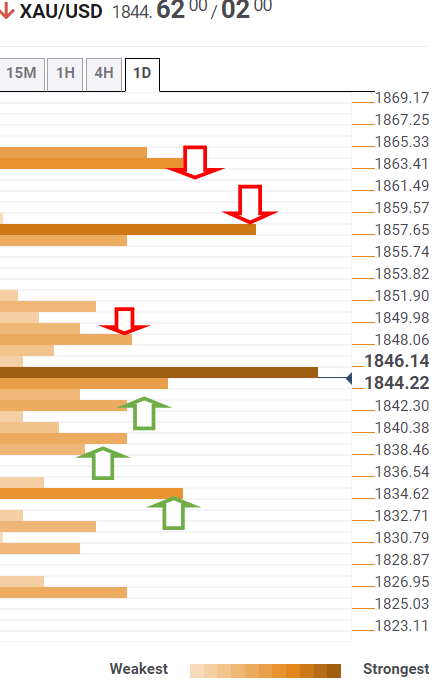
The Technical Confluence Detector shows that Gold Price is testing bids at $1,844, where the SMA10 one-day coincides with the Fibonacci 61.8% one-week.
If that latter caves in, then a dense cluster of healthy support levels is stacked up around $1,842, the confluence of the SMA200 one-day, SMA50 four-hour and Fibonacci 38.2% one-day.
Under that support, the pivot point one-week S1 at $1,839 could be put to test. The additional downside will challenge the bullish commitments at $1,835, the Fibonacci 38.2% one-month.
Alternatively, the Fibonacci 23.6% one-day at $1,848 will be the initial line of defense for gold sellers, above which a fresh advance towards the previous day’s high of $1,858 cannot be ruled out.
Powerful resistance appears at around $1,864, the convergence of the Fibonacci 61.8% one-month and Fibonacci 23.6% one-week. That demand area will be the level to beat for XAU bulls.
Here is how it looks on the tool
About Technical Confluences Detector
The TCD (Technical Confluences Detector) is a tool to locate and point out those price levels where there is a congestion of indicators, moving averages, Fibonacci levels, Pivot Points, etc. If you are a short-term trader, you will find entry points for counter-trend strategies and hunt a few points at a time. If you are a medium-to-long-term trader, this tool will allow you to know in advance the price levels where a medium-to-long-term trend may stop and rest, where to unwind positions, or where to increase your position size.
Author

Dhwani Mehta
FXStreet
Residing in Mumbai (India), Dhwani is a Senior Analyst and Manager of the Asian session at FXStreet. She has over 10 years of experience in analyzing and covering the global financial markets, with specialization in Forex and commodities markets.


