- Gold Price snaps a five-day uptrend, as the US dollar stages a solid rebound.
- US Treasury yields remain on the back foot ahead of the FOMC minutes.
- Strong support at $1,850 could limit the pullback in XAUUSD from two-week highs.
Gold Price is retreating from two-week highs of $1,870, as tensions mount in the lead-up to the minutes of the Fed May policy meeting, which is likely to provide fresh hints on the central bank’s tightening path. The broad rebound in the US dollar, despite a cautious market mood, is weighing negatively on the bright metal. Although the latest Fed commentary, which expressed concerns of soft-landing, undermines the US Treasury yields across the curve. This, in turn, helps XAUSUD to find a floor, for now.
Also read: Gold Price Forecast: XAUUSD bulls await Fed minutes for the next upside leg
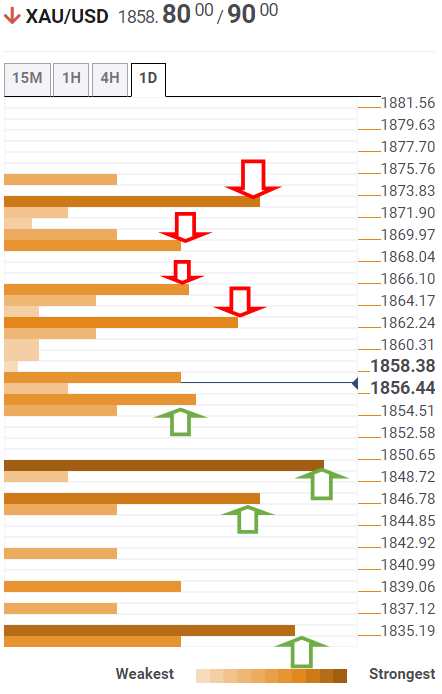
Gold Price: Key levels to watch
The Technical Confluences Detector shows that the Gold Price is teasing the $1,855 support area, which is the convergence of the pivot point one-day S1 and the previous low four-hour.
Failure to resist above the latter will trigger a fresh drop towards the $1,850 cap, where the previous day’s low and the previous week’s high coincide.
Gold sellers will then look out for the $1,845 demand zone, which is the intersection of the SMA5 one-day and pivot point one-month S1.
Further down, the SMA200 one-day at $1,839 will be put to test.
On the upside, XAU bulls could face initial resistance at around $1,862 on buying resurgence. That level is the confluence of the Fibonacci 38.2% one-day and SMA10 four-hour.
The Fibonacci 23.6% one-day at $1,865 will then challenge the bearish commitments.
The previous day’s high of $1,870 and the previous month’s low of $1,872 will be next on the buyers’ radars.
Here is how it looks on the tool
About Technical Confluences Detector
The TCD (Technical Confluences Detector) is a tool to locate and point out those price levels where there is a congestion of indicators, moving averages, Fibonacci levels, Pivot Points, etc. If you are a short-term trader, you will find entry points for counter-trend strategies and hunt a few points at a time. If you are a medium-to-long-term trader, this tool will allow you to know in advance the price levels where a medium-to-long-term trend may stop and rest, where to unwind positions, or where to increase your position size.
Information on these pages contains forward-looking statements that involve risks and uncertainties. Markets and instruments profiled on this page are for informational purposes only and should not in any way come across as a recommendation to buy or sell in these assets. You should do your own thorough research before making any investment decisions. FXStreet does not in any way guarantee that this information is free from mistakes, errors, or material misstatements. It also does not guarantee that this information is of a timely nature. Investing in Open Markets involves a great deal of risk, including the loss of all or a portion of your investment, as well as emotional distress. All risks, losses and costs associated with investing, including total loss of principal, are your responsibility. The views and opinions expressed in this article are those of the authors and do not necessarily reflect the official policy or position of FXStreet nor its advertisers. The author will not be held responsible for information that is found at the end of links posted on this page.
If not otherwise explicitly mentioned in the body of the article, at the time of writing, the author has no position in any stock mentioned in this article and no business relationship with any company mentioned. The author has not received compensation for writing this article, other than from FXStreet.
FXStreet and the author do not provide personalized recommendations. The author makes no representations as to the accuracy, completeness, or suitability of this information. FXStreet and the author will not be liable for any errors, omissions or any losses, injuries or damages arising from this information and its display or use. Errors and omissions excepted.
The author and FXStreet are not registered investment advisors and nothing in this article is intended to be investment advice.
Recommended content
Editors’ Picks
EUR/USD stays below 1.0900 as Q1 comes to an end

EUR/USD has lost its traction and declined below 1.0900 in the American session on Friday. Quarter-end flows seem to be allowing the US Dollar find some demand but the risk-positive market environment seems to be limiting the pair's downside ahead of the weekend.
GBP/USD trades below 1.2400, looks to post weekly gains

GBP/USD has edged lower after having tested 1.2400 earlier in the day but remains on track to end the third straight week in positive territory. The upbeat mood remains intact after soft PCE inflation data from the US, making it difficult for the US Dollar to continue to gather strength.
Gold tries to stabilize near $1,980 following earlier spike

Gold price has returned to the $1,980 area following a spike above $1,987 with the initial reaction to lower-than-expected PCE inflation figures from the US. Meanwhile, the benchmark 10-year US Treasury bond yield stays in the red near 3.5%, providing support to XAU/USD.
Will Dogecoin price pull an XRP and rally 60% next week?

Dogecoin price has been in a tight range bound movement since November 22. The recent recovery above the range low looks promising and hints at an explosive move for next week.
Week ahead – Nonfarm payrolls to set the tone for US dollar

With the banking turmoil receding, market participants will turn their attention back to economic releases. The spotlight will fall on the US employment report.