Gold Price Forecast: $1,800 likely to cap XAU/USD’s road to recovery – Confluence Detector
- Gold price rebounds but not out of the woods yet while below $1,800.
- Range play is likely to continue in gold amid Thanksgiving Holiday.
- Gold could stage a deep correction if $1,850 becomes resistance.

Gold is in the green for the first time this week, attempting to recover a part of Wednesday’s sell-off to the three-week low of $1,779. Thanksgiving Holiday in the US offers little motivation to the dollar bulls, as they consolidate the hawkish Fedspeak and minutes-led upside. The sluggish price action in the yields and the greenback is aiding the rebound in gold price. Further upside appears elusive, as the $1,800 mark is likely to be a tough nut to crack for gold bulls.
Read: Gold Price Forecast: Thanksgiving Day unlikely to offer respite to XAU/USD bulls amid a bear flag
Gold Price: Key levels to watch
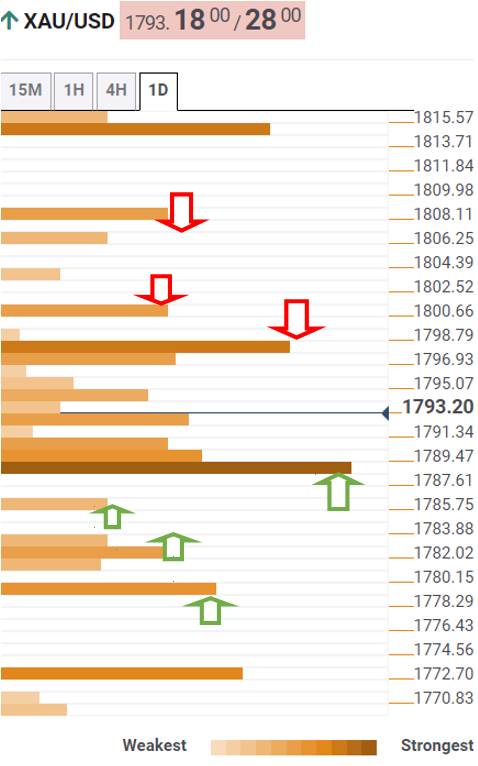
The Technical Confluences Detector shows that the gold price is defending critical support around $1,790, which is the intersection of the SMA50 one-day, Fibonacci 38.2% one-month and Fibonacci 61.8% one-day.
If the sellers find a strong foothold below the latter, then the recent downtrend could resume towards the Fibonacci 38.2% one-day at $1,785.
Further south, the confluence of the Fibonacci 23.6% one-day and Bollinger Band one-hour Lower at $1,782 will guard the downside.
The next stop for gold sellers is envisioned at $1,779, the meeting point of the previous day’s low and the pivot point one-day S1.
On the flip side, gold bulls need acceptance above the powerful $1,797 hurdle, which is the convergence of the Fibonacci 23.6% one-month, pivot point one-day R1 and the previous day’s high.
The next relevant upside target is seen at $1,800, the pivot point one-week S3.
The additional advances will then challenge the bearish commitments near $1,807, where the SMA200 four-hour, Fibonacci 161.8% one-day and pivot point one-day R2 merge.
Here is how it looks on the tool
About the Technical Confluences Detector
The TCD (Technical Confluences Detector) is a tool to locate and point out those price levels where there is a congestion of indicators, moving averages, Fibonacci levels, Pivot Points, etc. If you are a short-term trader, you will find entry points for counter-trend strategies and hunt a few points at a time. If you are a medium-to-long-term trader, this tool will allow you to know in advance the price levels where a medium-to-long-term trend may stop and rest, where to unwind positions, or where to increase your position size.
Author

Dhwani Mehta
FXStreet
Residing in Mumbai (India), Dhwani is a Senior Analyst and Manager of the Asian session at FXStreet. She has over 10 years of experience in analyzing and covering the global financial markets, with specialization in Forex and commodities markets.


