Gold Price Forecast: Thanksgiving Day unlikely to offer respite to XAU/USD bulls amid a bear flag
- Gold price attempts a dead cat bounce towards $1,800 amid retreating yields.
- Fed minutes reveal the policymakers’ readiness to accelerate taper, rate hikes.
- Gold price confirmed a bear flag on the 4H chart, impending bear cross lurks.

Gold price made a new three-week low of $1,779 on Wednesday, having extended its rout into the fifth straight day, as the Fed November meeting’s minutes exacerbated the pain in the bright metal. Already rife expectations of a faster pace of tapering and earlier rate hikes got additional fuel, after the Fed minutes revealed that the policymakers should be prepared to adjust the pace of the QE taper and raise rates sooner than currently anticipated should inflation continue to run hot.
Hawkish Fed minutes bolstered the US dollar’s rally, weighing negatively on the non-interest-bearing gold. However, the downside in the yellow metal was limited by the flattening of the Treasury yield curve, as the shorter duration rates climbed on hopes of a faster reduction in stimulus. Meanwhile, markets hung onto the dollar, overwhelmed by a flurry of relevant US economic data released, which came in mixed.
On Thursday, gold is replicating the price action seen in the Asian trades a day before, attempting a tepid bounce amid a brief pullback in the greenback. The US currency lacks the follow-through upside bias, as investors switch onto the sidelines amid a Thanksgiving Day holiday in the US. Despite the rebound, the risks remain skewed to the downside for gold price, as the Fed’s hawkishness will continue to underpin the sentiment around the dollar and yields.
Meanwhile, growing covid concerns in the European countries could keep the investors unnerved and scurrying for safety in the dollar at gold’s expense. Further, a sustained technical break below the $1,800 threshold continues to keep the sellers motivated.
Gold Price Chart - Technical outlook
Gold: Four-hour chart
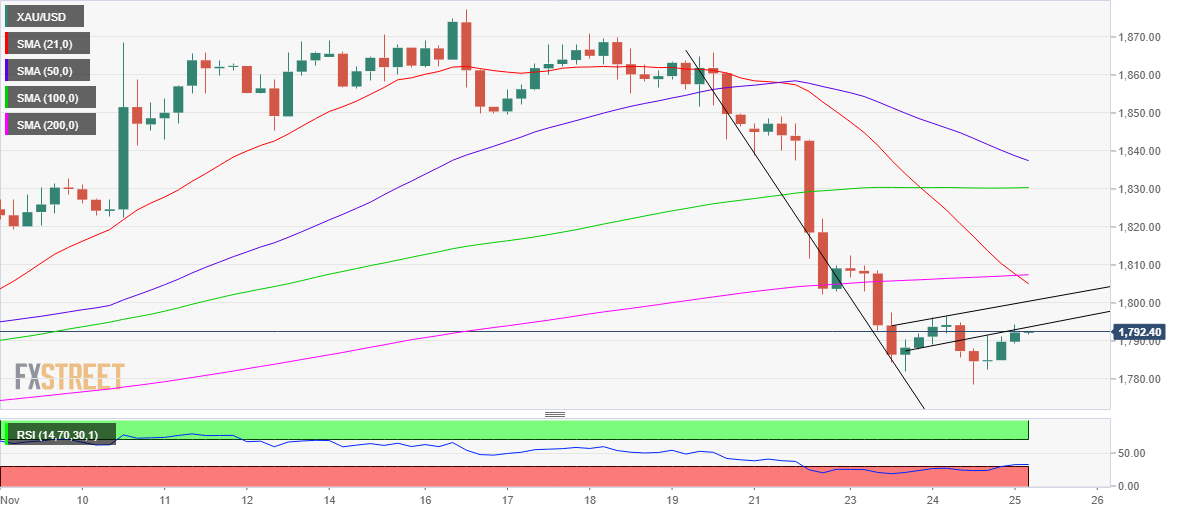
Gold price confirmed a bear flag formation on the four-hour chart Wednesday after closing the candlestick below the rising trendline support, then at $1,790.
The Relative Strength Index (RSI) has moved out of the oversold conditions, backing the recent rebound. However, the leading indicator remains well below the midline, hinting at ‘sell the bounce’ trading could be on the cards.
Adding credence to a potential move southward, the bearish 21-Simple Moving Average (SMA) is on the verge of piercing the horizontal 200-DMA from above, which if materialized will validate a bear cross.
With the bearish technical setup in play, all eyes remain on the pattern target measured at $1,707. Ahead of that, the November 4 low of $1,769 could come to the rescue of gold bulls. The $1,750 psychological level could be the next stop for the bears.
On the flip side, the rising trendline support now resistance at $1,794, offers an immediate upside barrier. Acceptance above the latter will enhance the recovery momentum towards the $1,800 level.
Further up, powerful resistance around $1,807 will be a nut to crack for gold bulls. At that point, the 200- and 21-SMAs coincide.
Author

Dhwani Mehta
FXStreet
Residing in Mumbai (India), Dhwani is a Senior Analyst and Manager of the Asian session at FXStreet. She has over 10 years of experience in analyzing and covering the global financial markets, with specialization in Forex and commodities markets.


