Gold Price Analysis: XAU/USD set to test July high at $1985 amid dovish Powell – Confluence Detector

Gold (XAU/USD) booked the first weekly gain in three weeks, settling 1.20% higher above the psychological $1950 mark. The metal almost tested the critical $1976 hurdle once again on Friday, as the dovish Fed narrative continued to pressure the US dollar alongside the Treasury yields.
Markets assessed the implications Fed Chair Powell’s call for lower rates for a longer period to achieve the dual goals of price and jobs growth. Further, looming uncertainty over the US fiscal stimulus and fresh Japanese political concerns also boded well for the safe-haven gold.
Heading into the US NFP week, will gold extend its bullish momentum? Let’s look at the key technical levels in order to get a better picture.
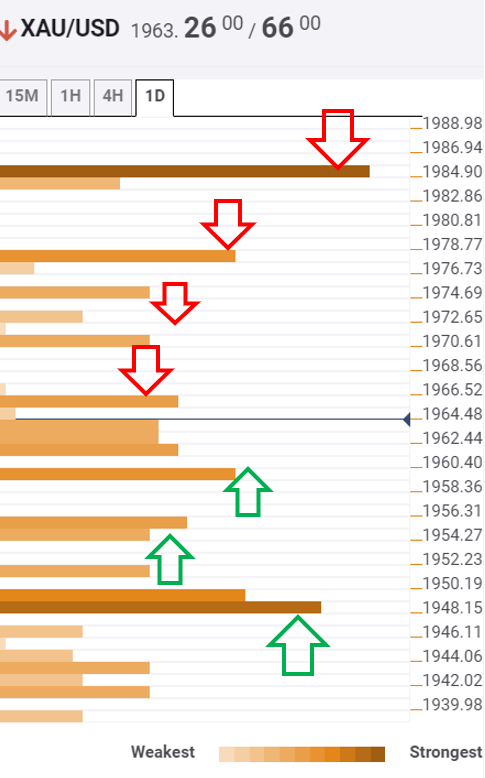
Gold: Key resistances and supports
The Technical Confluences Indicator is showing that the confluence of the previous high on four-hour, SMA5 one-hour and SMA10 15-minutes at $1966 could cap the immediate upside in gold.
XAU bulls may face an uphill task to reach the crucial resistance at $1976, the previous week high, as a bunch of minor hurdles around $1973 is aligned on their way north. That zone is where the previous day high, Bollinger Band one-day Middle and Bollinger Band four-hour Upper intersect.
Further up, the previous month high at $1985 will be on the buyers’ radars.
To the downside, the Fibonacci 23.6% one-week at $1960 could stall the corrective declines, below which the $1955 support will get exposed. That level is the convergence of the Fibonacci 38.2% one-day and Bollinger Band one-hour Middle.
Next on the sellers’ radar remain the $1950 level, which is the confluence of the Fibonacci 38.2% one-week and SMA100 15-minutes.
Robust support at $1947, the SMA10 on four-hour, will be put to test should the bulls fail to resist above the latter.
About Confluence Detector
The Confluence Detector finds exciting opportunities using Technical Confluences. The TC is a tool to locate and point out those price levels where there is a congestion of indicators, moving averages, Fibonacci levels, Pivot Points, etc. Knowing where these congestion points are located is very useful for the trader, and can be used as a basis for different strategies.
Author

Dhwani Mehta
FXStreet
Residing in Mumbai (India), Dhwani is a Senior Analyst and Manager of the Asian session at FXStreet. She has over 10 years of experience in analyzing and covering the global financial markets, with specialization in Forex and commodities markets.


