Gold Price Analysis: XAU/USD sellers still alive, with eyes on $1913 – Confluence Detector

Gold (XAU/USD) has caught a fresh bid-wave amid a broad-based US dollar retreat, as the market mood stays upbeat. Meanwhile, the renewed US-China tensions and falling Treasury yields collaborate with the bounce in the yellow metal.
However, it remains to be seen if the metal can sustain the pullback, as the dollar is likely to draw support from the dovish ECB expectations around the euro and rising Brexit concerns. Looking ahead, the sentiment on Wall Street will be key for the next direction in gold, as the US traders return from an extended weekend holiday.
How is gold positioned technically?
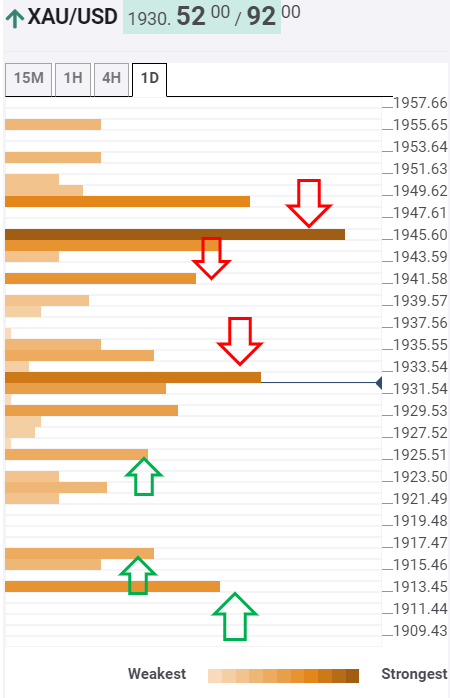
Gold: Key resistances and supports
The tool shows that gold briefly recaptured the critical resistance at $1932, which is the convergence of the previous high on four-hour and SMA50 one-hour.
Although, the bulls appear to lack follow-through, meeting supply just below the next hurdle at $1934, the Fibonacci 23.6% one-week.
Acceptance above the latter could call for a test of the major barrier at $1942, the intersection of the previous day high and SMA5 one-day.
The buyers will then fight hard to regain the robust resistance at $1945, where the SMA10 one-day and Fibonacci 38.2% one-week coincide.
To the downside, a failure to hold onto the $1929 level, the confluence of the Fibonacci 23.6% one-week and SMA5 four-hour, could open floors towards $1925 cushion. That level is the intersection of the previous day low and Bollinger Band one-hour Lower.
The next powerful support awaits at the previous week low of $1916, below which the Fibonacci 23.6% one-month at $1913 will challenge the bulls’ commitment.
Here is how it looks on the tool
About the Confluence Detector
With the TCI (Technical Confluences Indicator) tool, you can easily locate areas where the price can find a support zone or resistance zone and make trading decisions. If you are a short-term trader, you will find entry points for counter-trend strategies and hunt a few points each time. If you are a medium- and long-term trader, this tool will allow you to know in advance the price levels in which a medium / long-term trend can stop your travel and rest, where to undo positions or where to increase your position.
Learn more about Technical Confluence
Author

Dhwani Mehta
FXStreet
Residing in Mumbai (India), Dhwani is a Senior Analyst and Manager of the Asian session at FXStreet. She has over 10 years of experience in analyzing and covering the global financial markets, with specialization in Forex and commodities markets.


