|

Gold Price Analysis: XAU/USD path of least resistance is down, $1,673 eyed – Confluence Detector

The Senate's stimulus approval has been only the latest blow for gold – which is selling off as US bond yields are on the rise. Investors are repricing growth and inflation prospects into US Treasuries and that makes the yieldless precious metal less attractive.  

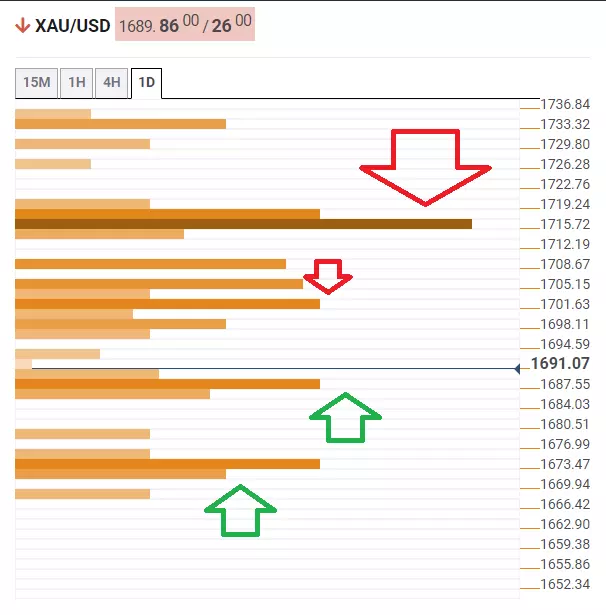
Where is the bottom? Unfortunately for bulls, XAU/USD is technically poorly positioned. 

The Technical Confluences Detector is showing that gold faces several layers of resistance, with the first cluster awaiting at $1,700, which is the convergence of the Fibonacci 38.2% one-day, the Simple Moving Average 100-15m, the SMA 50-1h, the Bollinger Band 1h-Middle, and others. 

Another notable cap awaits XAU/USD at $1,715, which is a meeting point including the BB 1h-Upper, the Fibonacci 38.2% one-week and the previous month's low.

Looking down, immediate support awaits at $1,687, which is where the BB one-day Lower, the BB 1h-Lower and the previous day's low all hit the price.

Further down, bears are targeting $1,673, which is the convergence of the Pivot Point one-month S1, the PP one-week S1 and others.   

XAU/USD resistance and support levels

Confluence Detector

The Confluence Detector finds exciting opportunities using Technical Confluences. The TC is a tool to locate and point out those price levels where there is a congestion of indicators, moving averages, Fibonacci levels, Pivot Points, etc. Knowing where these congestion points are located is very useful for the trader, and can be used as a basis for different strategies.

Learn more about Technical Confluence

Author

Yohay Elam

Yohay Elam

FXStreet

Yohay is in Forex since 2008 when he founded Forex Crunch, a blog crafted in his free time that turned into a fully-fledged currency website later sold to Finixio.

More from Yohay Elam
Share:

Editor's Picks

EUR/USD appears supported by the 200-day SMA, for now

Following an early pullback to multi-week lows near 1.1670, EUR/USD now manages to reclaim the 1.1700 region as the NA session draws to a close on Monday. The steep retracement in spot follows the equally strong move higher in the US Dollar, as investors continue to assess the geopolitical landscape in the wake of the US and Israel attacks on Iran.


GBP/USD hits new yearly lows near 1.3300

GBP/USD adds to the recent bearish tone, approaching to the key 1.3300 support to reach fresh YTD troughs against the backdrop of the robust performance of the US Dollar. Indeed, Cable’s decline comes amid the firm demand for the safe-haven space in the wake of the US and Israel attacks to Iran.

Gold eases some ground, approaches $5,300

Gold now surrenders part of the earlier advance, reshifting its attenton to the $5,300 zone per troy ounce at the beginning of the week. Indeed, the yellow metal’s firm performance appears propped up by incresing geopolitical jitters in the Middle East, which at the same time fuels the demand for the safe-haven space.

Strategy lifts holdings to 3.4% of Bitcoin's total supply amid inflows into crypto products

Strategy continued its accumulation of the top crypto last week, acquiring 3,015 BTC for $204 million amid renewed interest in crypto products after four weeks of outflows.

The Fed is finally talking about AI – Here's why it matters for the US Dollar

AI is moving from earnings calls into the heart of monetary policy discussions, forcing Federal Reserve officials to confront a new question: How to act if AI reshapes inflation, employment and interest rates at the same time?

Grass 20% bullish breakout defies broader market weakness

Grass (GRASS) is edging up above $0.30 at the time of writing on Monday. The token’s notable 20% intraday surge stands out amid heightened volatility in the broader crypto market.