|

Gold Price Analysis: XAU/USD pares early gains, holds above $1,770

  • XAU/USD lost its traction after advancing to multi-month highs.
  • Near-term support seems to have formed a little below $1,770.
  • Gold continues to react to fluctuations in US Treasury bond yields.

The XAU/USD pair managed to build on last week's gains and touched its highest level since late February at $1,790 on Monday. However, the pair failed to preserve its bullish momentum in the second half of the day and reversed its direction. As of writing, XAU/USD was losing 0.13% on a daily basis at $1,774.

In the absence of significant fundamental drivers, the US Treasury bond yields' performance continues to impact gold's valuation. The benchmark 10-year US Treasury bond yield, which spent the first half of the day in the negative territory, was last seen rising nearly 1% on the day. 

Gold technical outlook

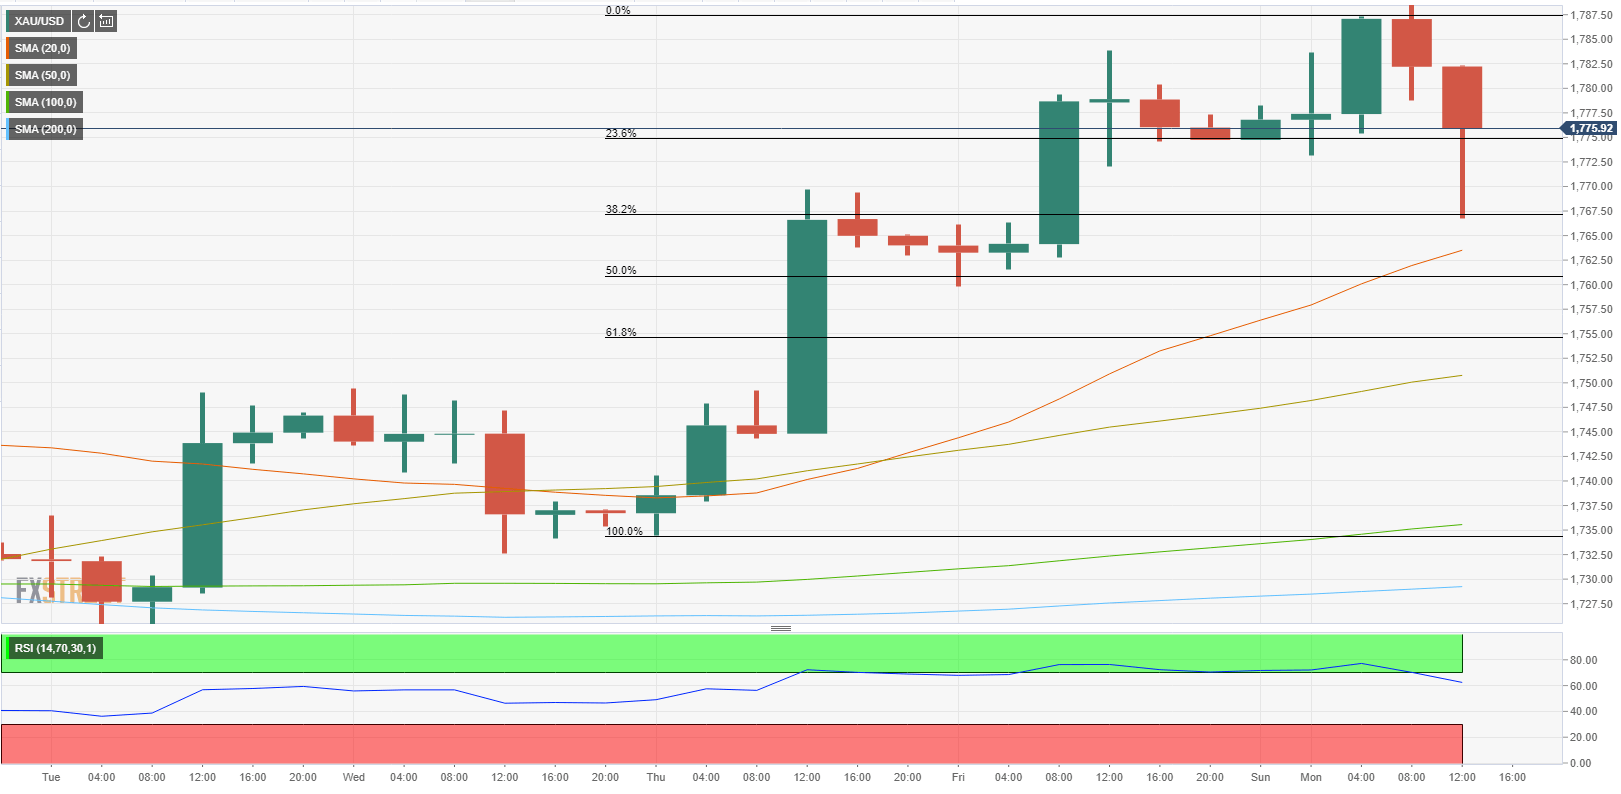
On the four hour chart, the 38.2% Fibonacci retracement of the rally that started last week on Thursday and ended earlier in the day on Monday seems to have formed strong support at $1,767. Meanwhile, the Relative Strength Index (RSI) indicator on the same chart continues to hold above 50, suggesting that the pair is staging a technical correction. Below $1,767, the 20-period SMA aligns as the next support at $1,764 ahead of $1,760 (Fibonacci 50% retracement).

On the flip side, the pair could target $1,790, once again, if it closes a four-hour candle above $1,775 (Fibonacci 23.6% retracement). Finally, $1,800 (psychological level) could be seen as the next target on the upside if bulls retake control of the price.

Additional levels to watch for

XAU/USD

Overview
Today last price1773.82
Today Daily Change-0.93
Today Daily Change %-0.05
Today daily open1774.75
 
Trends
Daily SMA201735.09
Daily SMA501752.17
Daily SMA1001804.89
Daily SMA2001857.65
 
Levels
Previous Daily High1783.85
Previous Daily Low1759.82
Previous Weekly High1783.85
Previous Weekly Low1723.8
Previous Monthly High1759.98
Previous Monthly Low1676.87
Daily Fibonacci 38.2%1774.67
Daily Fibonacci 61.8%1769
Daily Pivot Point S11761.76
Daily Pivot Point S21748.78
Daily Pivot Point S31737.73
Daily Pivot Point R11785.79
Daily Pivot Point R21796.84
Daily Pivot Point R31809.82

Author

Eren Sengezer

As an economist at heart, Eren Sengezer specializes in the assessment of the short-term and long-term impacts of macroeconomic data, central bank policies and political developments on financial assets.

More from Eren Sengezer
Share:

Editor's Picks

EUR/USD holds losses below 1.1650 on renewed USD uptick

EUR/USD is off the low but remains in the red below 1.1650 in European trading on Thursday. The pair faces headwinds from a renewed uptick in the US Dollar amid a negative shift in risk sentiment. Surging energy prices due to the Middle East war keep the bearish pressure intact on the Euro. The US Jobless Claims data are next of note. 

GBP/USD stays weak near 1.3350 amid UK stagflation risks

GBP/USD sticks to losses near 1.3350 in the European session on Thursday. The Pound Sterling loses ground amid fears that the United Kingdom economy could face stagflation risks due to higher energy prices, while the US Dollar attracts fresh havem demand ahead of the US Jobless Claims data. 

Gold climbs near $5,200 as Iran war fuels safe-haven demand

Gold price extends its gains for the second successive session on Thursday as traders seek safety amid the ongoing war in the Middle East. US and Israeli strikes across Iranian territory and widespread Iranian missile and drone retaliation across the Middle East, including attacks on regional targets and military sites, prolong the crisis and its impact.

Top Crypto Gainers: Decred, Zcash, and Dogecoin lead recovery as Bitcoin crosses $72,000

Bitcoin trades above $72,500 at press time on Thursday, holding its 6% gain from the previous day, contributing to a broader market recovery. The total cryptocurrency market capitalization stands at over $2.43 trillion as the broader market sentiment improves significantly.

First Venezuela, now Iran: The US-China energy war escalates

At first glance, the latest escalation involving the United States with both Iran and Venezuela looks like another chapter in a long-running geopolitical story. But viewed through a broader strategic lens, something else may be unfolding: Energy.

Cardano Price Analysis: Approaches key trendline amid bearish sentiment

Cardano (ADA) price is approaching its descending trendline around $0.28 at the time of writing, set to shape the next directional move. The derivatives metrics paint a bearish picture, with ADA’s Open Interest continuing to fall and short bets rising among traders.