|

Gold Price Analysis: XAU/USD hovers near $1,900, daily chart shows bearish pattern

  • Gold's daily chart shows a descending triangle breakdown. 
  • Key indicators have aligned in favor of the bears. 

The path of least resistance for gold appears to be on the downside, as the yellow metal's daily chart shows a bearish pattern, and the US dollar is breaking higher from its multi-week trading range. 

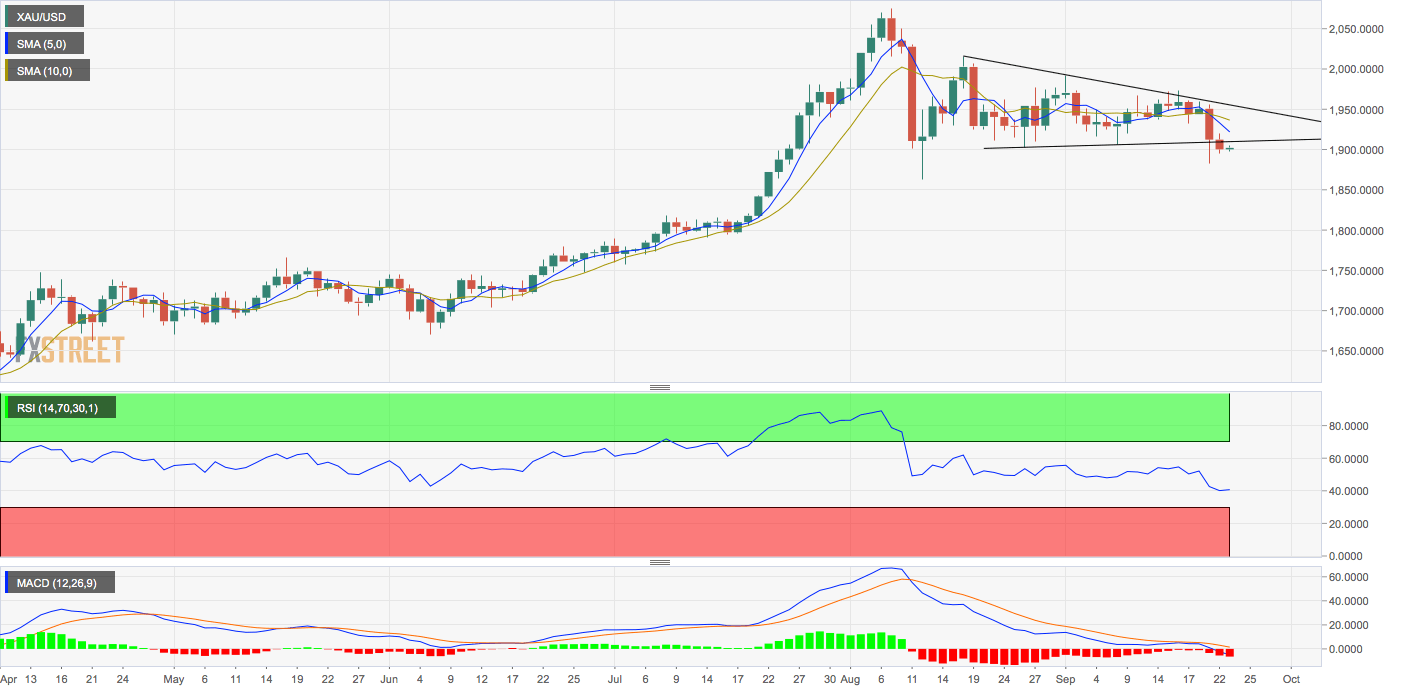
The metal closed Tuesday with a 0.66% loss at $1,899 per ounce, confirming a downside break of a descending triangle represented by trendline connecting Aug. 18 and Sept. 1 highs and Aug. 26 and Sept. 8 lows. 

The triangle breakdown indicates the four-week price consolidation has ended, and the pullback from the Aug. 7 record high of $2,075 has resumed. 

The breakdown is backed by a below-50 or bearish reading on the 14-day relative strength index and descending 5- and 10-day simple moving averages. 

The MACD histogram is again printing deeper bars below the zero line – a sign of the strengthening of the bearish momentum. 

As such, the metal risks falling to the Aug. 12 low of $1,863. A close above the descending 10-day SMA, currently at $1,936, is needed to invalidate the bearish view. 

Daily chart

Trend: Bearish

Technical levels

XAU/USD

Overview
Today last price1901.78
Today Daily Change1.61
Today Daily Change %0.08
Today daily open1900.17
 
Trends
Daily SMA201943.11
Daily SMA501939.07
Daily SMA1001840.53
Daily SMA2001719.01
 
Levels
Previous Daily High1920.04
Previous Daily Low1894.79
Previous Weekly High1973.64
Previous Weekly Low1932.88
Previous Monthly High2075.32
Previous Monthly Low1863.24
Daily Fibonacci 38.2%1904.44
Daily Fibonacci 61.8%1910.39
Daily Pivot Point S11889.96
Daily Pivot Point S21879.75
Daily Pivot Point S31864.71
Daily Pivot Point R11915.21
Daily Pivot Point R21930.25
Daily Pivot Point R31940.46

Author

Omkar Godbole

Omkar Godbole

FXStreet Contributor

Omkar Godbole, editor and analyst, joined FXStreet after four years as a research analyst at several Indian brokerage companies.

More from Omkar Godbole
Share:

Editor's Picks

EUR/USD deflates to fresh lows, targets 1.1600

The selling pressure on EUR/USD now gathers extra pace, prompting the pair to hit fresh multi-week lows in the 1.1625-1.1620 band on Friday. The continuation of the downward bias comes in response to further gains in the US Dollar as market participants continue to assess the mixed release of US Nonfarm Payrolls in December.

GBP/USD breaks below 1.3400, challenges the 200-day SMA

GBP/USD remains under heavy fire and retreats for the fourth consecutive day on Friday. Indeed, Cable suffers the strong performance of the Greenback, intensified post-mixed NFP, and trades at shouting distance from its critical 200-day SMA near 1.3380.

Gold flirts with yearly tops around $4,500

Gold keeps its positive bias on Friday, adding to Thursday’s advance and challenging yearly highs in the $4,500 region per troy ounce. The risk-off sentiment favours the yellow metal despite the firmer tone in the Greenback and rising US Treasury yields.

Crypto Today: Bitcoin, Ethereum, XRP risk further decline as market fear persists amid slowing demand

Bitcoin holds $90,000 but stays below the 50-day EMA as institutional demand wanes. Ethereum steadies above $3,000 but remains structurally weak due to ETF outflows. XRP ETFs resume inflows, but the price struggles to gain ground above key support.

Week ahead – US CPI might challenge the geopolitics-boosted Dollar

Geopolitics may try to steal the limelight from US data. A possible US Supreme Court ruling on tariffs could dictate market movements. A crammed data calendar next week, US CPI comes on Tuesday; Fedspeak to intensify.

XRP trades under pressure amid weak retail demand

XRP presses down on the 50-day EMA support as risk-averse sentiment spreads despite a positive start to 2026. XRP faces declining retail demand, as reflected in futures Open Interest, which has fallen to $4.15 billion.