|

Dollar Index price analysis: Rises above 94 for first since July 27

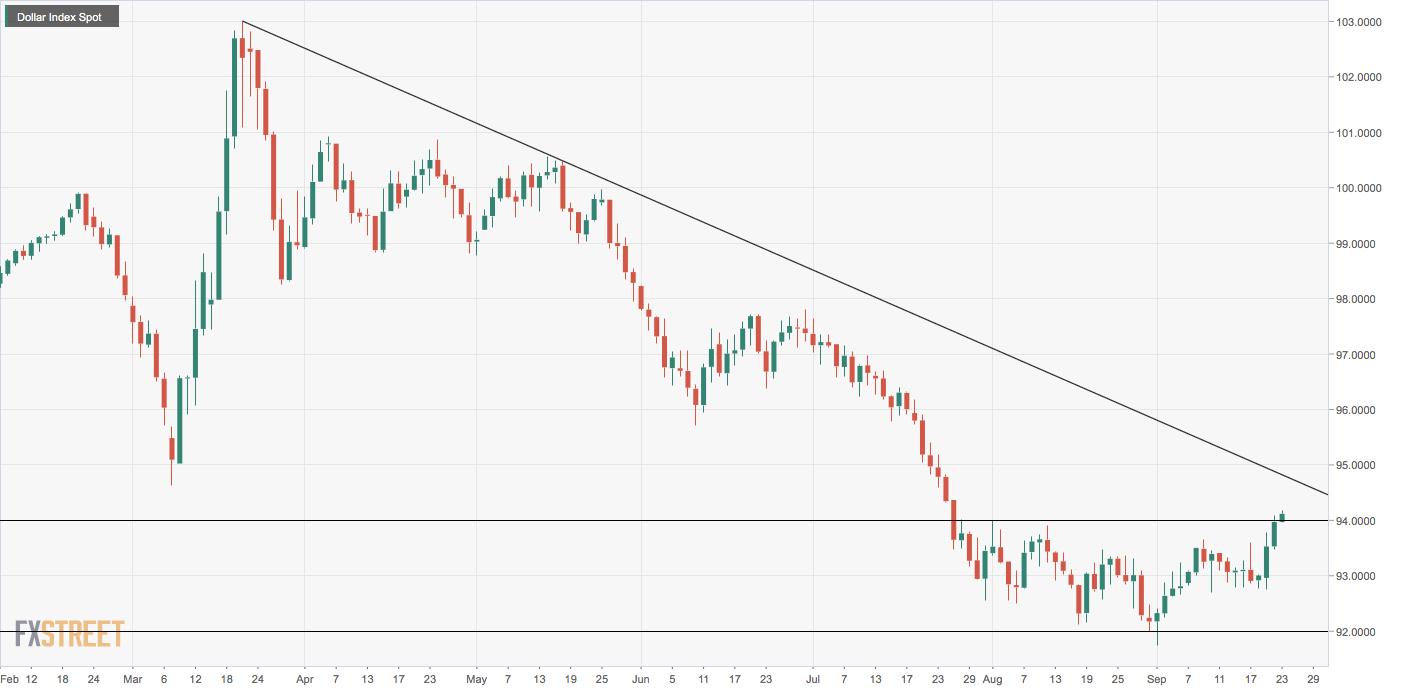
  • The dollar index is breaking higher from its multi-week sideways channel. 
  • The index is yet to clear the six-month bearish trendline. 

The dollar index (DXY), which tracks the safe-haven greenback's value against majors, is rising in Asia despite an uptick in the Asian stocks and overnight gains on Wall Street. 

The DXY is currently seen at 94.16 – the highest level since July 27. 

A close above 94 would imply a bullish breakout from the two-month-long consolidation of 92.00 to 94.00 and open the doors for 96.00 (target as per the measured move method). 

On the way higher, the trendline falling from March and May highs could offer resistance. As of writing, that descending trendline hurdle is located at 94.70. 

Should the index fail to hold above 94.00, stronger selling pressure will likely emerge, yielding a drop to 93.50. 

Daily chart
Trend: Bullish

Technical levels

Dollar Index Spot

Overview
Today last price94.14
Today Daily Change0.17
Today Daily Change %0.18
Today daily open93.97
 
Trends
Daily SMA2093
Daily SMA5093.48
Daily SMA10095.71
Daily SMA20097.16
 
Levels
Previous Daily High94.08
Previous Daily Low93.47
Previous Weekly High93.61
Previous Weekly Low92.77
Previous Monthly High94
Previous Monthly Low92
Daily Fibonacci 38.2%93.85
Daily Fibonacci 61.8%93.7
Daily Pivot Point S193.6
Daily Pivot Point S293.23
Daily Pivot Point S392.98
Daily Pivot Point R194.21
Daily Pivot Point R294.46
Daily Pivot Point R394.83

Author

Omkar Godbole

Omkar Godbole

FXStreet Contributor

Omkar Godbole, editor and analyst, joined FXStreet after four years as a research analyst at several Indian brokerage companies.


More from Omkar Godbole
Share:

Editor's Picks

GBP/USD flirts with tops near 1.3470

GBP/USD manages to regain composure and challenge the area of daily highs around 1.3470 on Friday. Cable picks up pace despite marginal gains in the Greenback in a context of swelling geopolitical tensions and rising global oil prices.

EUR/USD gains traction above 1.1500 constrained below 100-day SMA

The EUR/USD pair trades in positive territory near 1.1535 during the early European trading hours, bolstered by improved risk sentiment. The Euro edges higher against the US Dollar after reports that US President Donald Trump had called off an attack on Iran and talks between the two sides would happen on Monday. Traders will closely monitor the developments surrounding US-Iran negotiations.

Gold's struggle with 21-day SMA extends ahead of US-Iran talks

Gold keeps its range around $4,050 early Monday, consolidating the previous decline. The US Dollar holds losses, fuelled by the USD/JPY slump and Mideast diplomacy hopes. Gold awaits a clear directional breakthrough, but sellers likely have the upper hand on the 1D chart.

Week ahead: US payrolls report and AI earnings to keep investors on edge

After the Fed decision, NFP report awaited for more rate hike clues. Employment also on the agenda in Canada and New Zealand. Chinese trade and Japanese wage data to be watched too. But Iran and AI headlines to remain in driver’s seat for risk sentiment.

Solana risks a steeper decline below $70 despite steady ETF inflows

Solana (SOL) is trading in the red, losing bullish momentum and remaining capped below its 50-day Exponential Moving Average at $75.68. SOL-focused Exchange Traded Funds show resilience with a monthly inflow of $14.62 million in July, while the near-term retail support wanes with the funding rate turning negative.

9-3: Is the Federal Reserve’s vote tally Warsh's new forward guidance?
The rate did not move. Neither did the statement, and that’s the more interesting fact. Set the July 29 Federal Open Market Committee (FOMC) statement beside the one issued on June 17, and the two documents are identical apart from a single verb and a paragraph at the bottom naming three dissenters.