Gold is holding up above $1900, looking to extend gains into the third straight day on Wednesday, despite the recent broad US dollar strength. Risk-aversion remains in play amid likely imposition of tighter COVID-19 restrictions in Europe’s top economies, as the second-wave tightens its grip.
Also, benefiting the yieldless gold is the sell-off in the US Treasury yields across the curve amid faltering US economic recovery and election anxiety. Fading prospects of US fiscal stimulus also weighs on the investors’ sentiment.
How is gold positioned technically?
Gold: Key resistances and supports
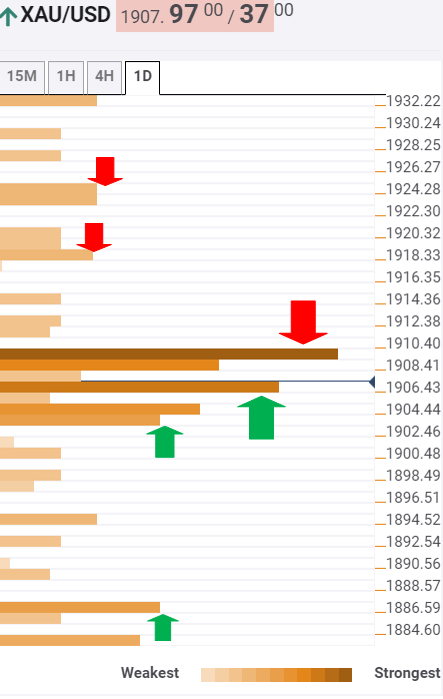
The Technical Confluences Indicator shows that the yellow metal is trying hard to overcome powerful resistance at $1909.40, which is the convergence of the SMA200 four-hour and Fibonacci 61.8% one-week.
Acceptance above the latter will revive the bullish momentum, with the next major resistance seen at $1919, where the Fibonacci 38.2% one-week is placed.
Further north, the bulls will test the $1923 barrier, the intersection of the pivot point one-week R1 and Fibonacci 23.6% one-week. The previous week high of $1932 will be back on the buyers’ radars.
Alternatively, an immediate cushion is set at $1906, which is the meeting point of the Fibonacci 38.2% one-day, SMA100 four-hour and SMA10 one-day.
A firm break below the last could call for a test of the next support at $1902, the previous low on four-hour and Fibonacci 61.8% one-day convergence.
Selling pressure is likely to intensify below the latter, opening floors towards the next downside target of $1887, which is the confluence of the pivot point one-week S1 and pivot point one-day S3.
Here is how it looks on the tool
About Confluence Detector
The Confluence Detector finds exciting opportunities using Technical Confluences. The TC is a tool to locate and point out those price levels where there is a congestion of indicators, moving averages, Fibonacci levels, Pivot Points, etc. Knowing where these congestion points are located is very useful for the trader, and can be used as a basis for different strategies.
Information on these pages contains forward-looking statements that involve risks and uncertainties. Markets and instruments profiled on this page are for informational purposes only and should not in any way come across as a recommendation to buy or sell in these assets. You should do your own thorough research before making any investment decisions. FXStreet does not in any way guarantee that this information is free from mistakes, errors, or material misstatements. It also does not guarantee that this information is of a timely nature. Investing in Open Markets involves a great deal of risk, including the loss of all or a portion of your investment, as well as emotional distress. All risks, losses and costs associated with investing, including total loss of principal, are your responsibility. The views and opinions expressed in this article are those of the authors and do not necessarily reflect the official policy or position of FXStreet nor its advertisers. The author will not be held responsible for information that is found at the end of links posted on this page.
If not otherwise explicitly mentioned in the body of the article, at the time of writing, the author has no position in any stock mentioned in this article and no business relationship with any company mentioned. The author has not received compensation for writing this article, other than from FXStreet.
FXStreet and the author do not provide personalized recommendations. The author makes no representations as to the accuracy, completeness, or suitability of this information. FXStreet and the author will not be liable for any errors, omissions or any losses, injuries or damages arising from this information and its display or use. Errors and omissions excepted.
The author and FXStreet are not registered investment advisors and nothing in this article is intended to be investment advice.
Recommended content
Editors’ Picks
AUD/USD remained bid above 0.6500
AUD/USD extended further its bullish performance, advancing for the fourth session in a row on Thursday, although a sustainable breakout of the key 200-day SMA at 0.6526 still remain elusive.
EUR/USD faces a minor resistance near at 1.0750
EUR/USD quickly left behind Wednesday’s small downtick and resumed its uptrend north of 1.0700 the figure, always on the back of the persistent sell-off in the US Dollar ahead of key PCE data on Friday.
Gold holds around $2,330 after dismal US data
Gold fell below $2,320 in the early American session as US yields shot higher after the data showed a significant increase in the US GDP price deflator in Q1. With safe-haven flows dominating the markets, however, XAU/USD reversed its direction and rose above $2,340.
Bitcoin price continues to get rejected from $65K resistance as SEC delays decision on spot BTC ETF options
Bitcoin (BTC) price has markets in disarray, provoking a broader market crash as it slumped to the $62,000 range on Thursday. Meanwhile, reverberations from spot BTC exchange-traded funds (ETFs) continue to influence the market.
US economy: slower growth with stronger inflation
The dollar strengthened, and stocks fell after statistical data from the US. The focus was on the preliminary estimate of GDP for the first quarter. Annualised quarterly growth came in at just 1.6%, down from the 2.5% and 3.4% previously forecast.