Gold Price Analysis: XAU/USD extends the rangebound price moves around $1730 area
- A combination of diverging forces failed to provide any meaningful impetus to gold.
- The range-bound price action constitutes the formation of a bearish rectangle pattern.
- Neutral oscillators warrant caution before positioning for any firm near-term direction.

Gold lacked any intraday directional bias and seesawed between tepid gains/minor losses through the first half of the European session. The commodity was last seen trading around the $1730 region, nearly unchanged for the day.
Concerns that the third wave of COVID-19 infections and pandemic-related restrictions could delay the global economic recovery extended some support to the safe-haven XAU/USD. However, a generally positive tone around the equity markets, stronger US dollar and a modest uptick in the US Treasury bond yields capped the upside for the commodity.
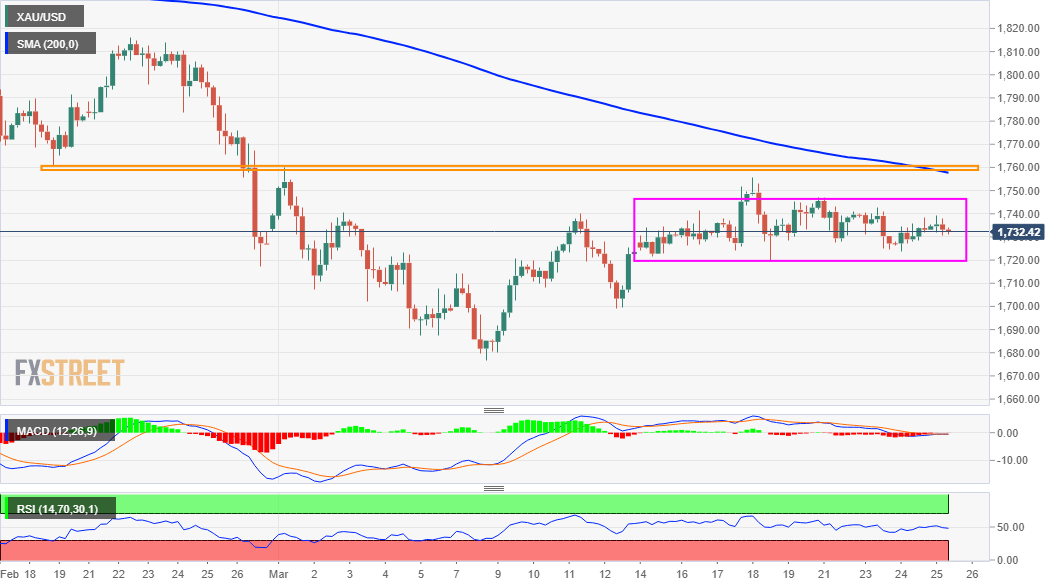
Looking at the technical picture, the XAU/USD has been oscillating in a narrow trading band over the past two weeks or so – barring the post-FOMC move up. The range-bound price action constitutes the formation of a rectangle pattern on hourly charts. This might still be categorized as a bearish continuation pattern, marking a brief pause in the trend.
The negative outlook is reinforced by the fact that the XAU/USD has repeatedly struggled to find acceptance above the $1742-44 supply zone. That said, neutral technical indicators haven't been supportive of any firm near-term direction. This makes it prudent to wait for a sustained move in either direction before placing any aggressive bets.
Meanwhile, the lower boundary of the trading range, around the $1720 region might continue to act as immediate support. A convincing break below will reaffirm a bearish break and drag the commodity to the $1700 mark. The downfall could further get extended back towards multi-month lows, around the $1677-76 region touched earlier this month.
On the flip side, the $1742-44 region remains a strong hurdle. A sustained breakthrough, leading to a subsequent strength beyond the trading range resistance, around the $1748 level, will be seen as a key trigger for bullish traders. The XAU/USD might then accelerate the move towards challenging the $1760-65 strong horizontal support breakpoint.
The latter coincides with 200-period SMA on the 4-hourly chart, which if cleared decisively will set the stage for additional gains. The precious metal might then surpass an intermediate barrier near the $1773-75 region and aim to reclaim the $1800 mark.
XAU/USD 4-hourly chart
Technical levels to watch
Author

Haresh Menghani
FXStreet
Haresh Menghani is a detail-oriented professional with 10+ years of extensive experience in analysing the global financial markets.


