|

Gold Price Analysis: XAU/USD due for a breakout, according to key indicator

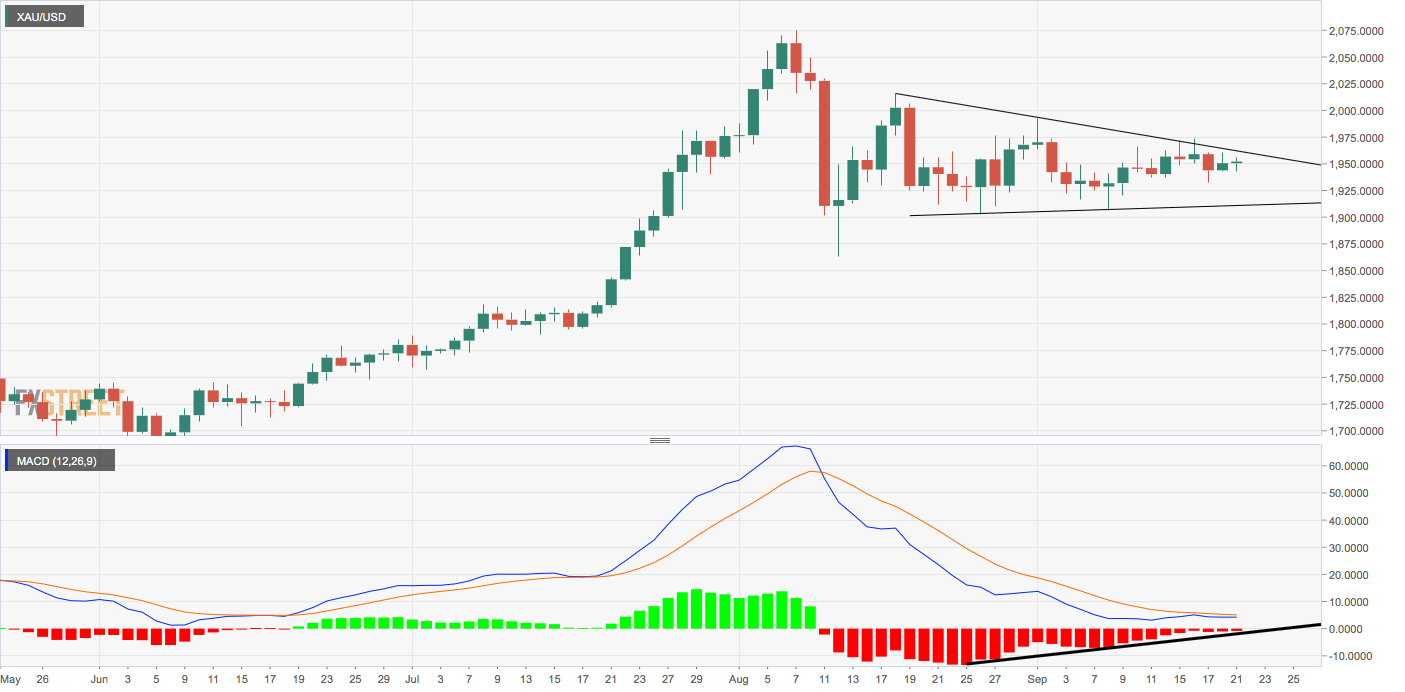
  • Gold remains stuck in a four-week-long descending triangle. 
  • A widely-tracked momentum indicator is teasing a bullish revival. 

Gold's multi-week consolidation in a narrowing price range could end with a bullish breakout, as a widely-tracked daily chart indicator is about to turn bullish. 

The yellow metal has carved out a descending triangle pattern over the past four weeks. The triangle's upper end or resistance is currently located at $1,960, and support is seen at $1,910.  Gold is trading at $1,953 per ounce at press time, representing a 0.13% gain on the day. 

The daily chart MACD histogram, an indicator used to gauge trend strength and trend reversal, is printing higher lows below the zero line, a sign of weakening of the bearish momentum. Besides, the indicator now looks set to cross into bullish territory above zero. 

As such, gold could soon take out the triangle resistance at $1,960. That would open the doors for $2,015 (Aug. 18 high). 

Daily chart

Trend: Bullish above $1,960

Technical levels

XAU/USD

Overview
Today last price1953.27
Today Daily Change2.72
Today Daily Change %0.14
Today daily open1950.55
 
Trends
Daily SMA201945.37
Daily SMA501935.06
Daily SMA1001836.48
Daily SMA2001714.71
 
Levels
Previous Daily High1960.16
Previous Daily Low1943.09
Previous Weekly High1973.64
Previous Weekly Low1932.88
Previous Monthly High2075.32
Previous Monthly Low1863.24
Daily Fibonacci 38.2%1953.64
Daily Fibonacci 61.8%1949.61
Daily Pivot Point S11942.37
Daily Pivot Point S21934.2
Daily Pivot Point S31925.3
Daily Pivot Point R11959.44
Daily Pivot Point R21968.34
Daily Pivot Point R31976.51

Author

Omkar Godbole

Omkar Godbole

FXStreet Contributor

Omkar Godbole, editor and analyst, joined FXStreet after four years as a research analyst at several Indian brokerage companies.

More from Omkar Godbole
Share:

Markets move fast. We move first.

Orange Juice Newsletter brings you expert driven insights - not headlines. Every day on your inbox.

By subscribing you agree to our Terms and conditions.

Editor's Picks

EUR/USD falls toward 1.1700 on broad USD recovery

EUR/USD turns south and declines toward 1.1700 on Wednesday. The US Dollar gathers recovery momentum and forces the pair to stay on the back foor, as traders look to USD short-covering ahead of US inflation report on Thursday. However, the downside could be capped by hawkish ECB expectations. 

GBP/USD trades deep in red below 1.3350 after soft UK inflation data

GBP/USD stays under strong selling pressure midweek and trades below 1.3350. The UK annual headline and core CPI rose by 3.2% each, missing estimates of 3.5% and 3.4%, respectively, reaffirming dovish BoE expectations and smashing the Pound Sterling across the board ahead of Thurday's BoE policy announcements. 

Gold clings to moderate daily gains above $4,300

Following Tuesday's volatile action, Gold regains its traction on Wednesday and trades in positive territory above $4,300. While the buildup in the USD recovery momentum caps XAU/USD's upside, the cautious market stance helps the pair hold its ground.

Bitcoin risks deeper correction as ETF outflows mount, derivative traders stay on the sidelines

Bitcoin (BTC) remains under pressure, trading below $87,000 on Wednesday, nearing a key support level. A decisive daily close below this zone could open the door to a deeper correction.

Monetary policy: Three central banks, three decisions, the same caution

While the Fed eased its monetary policy on 10 December for the third consecutive FOMC meeting, without making any guarantees about future action, the BoE, the ECB and the BoJ are holding their respective meetings this week. 

Crypto Today: Bitcoin, Ethereum, XRP slide further as risk-off sentiment deepens

Bitcoin faces extended pressure as institutional investors reduce their risk exposure. Ethereum’s upside capped at $3,000, weighed down by ETF outflows and bearish signals. XRP slides toward November’s support at $1.82 despite mild ETF inflows.