|

Gold Price Analysis: Stuck in a broadening channel on the 5-min chart

  • Gold lacks clear directional bias with prices stuck in an expanding sideways channel. 
  • A breakout would open the doors for re-test of record highs.

Gold has carved out a broadening sideways channel on the 5-minute chart. At press time, the yellow metal is trading largely unchanged on the day near $1,957 per ounce. 

A break below the lower end or support of the broadening channel, currently at $1,945, would validate the ascending channel breakdown witnessed during the overnight trade and shift risk in favor fo a drop to lows below $1,910 observed on Tuesday. 

Alternatively, a move above the channel hurdle at $1,966 would imply a resumption of the rally from lows below $1,910 and open the doors to re-test of the record high of $1,981.20 reached during Tuesday's Asian trading hours. 

5-minute chart
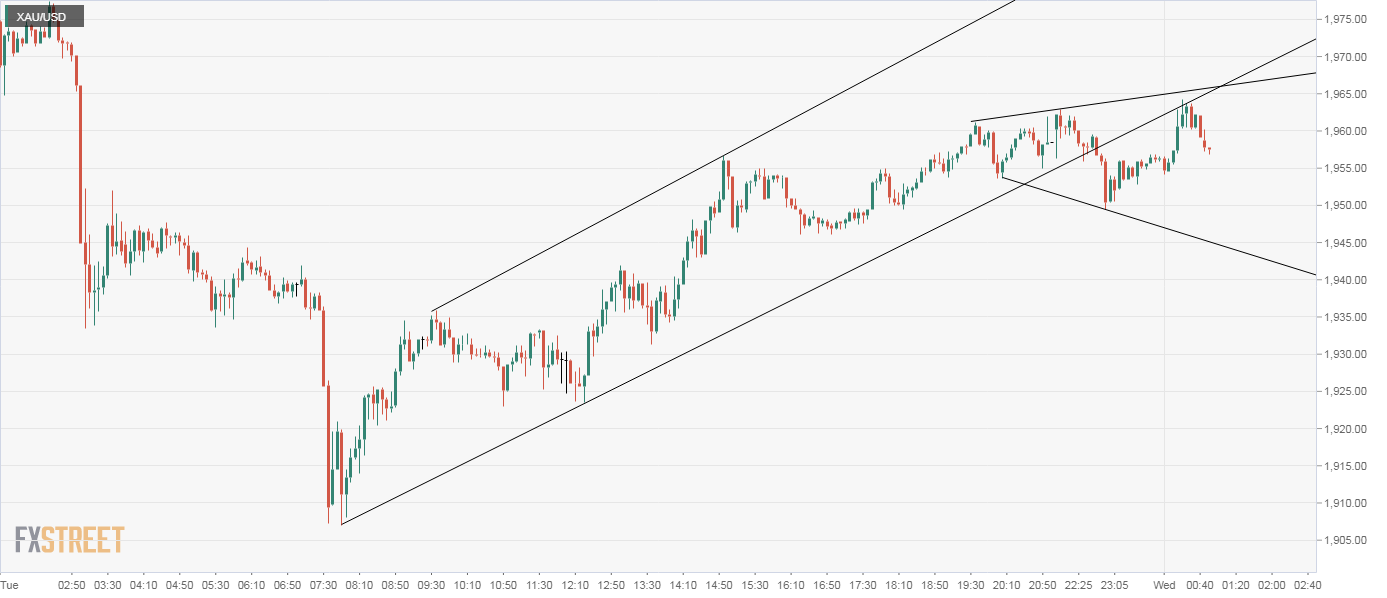
Trend: Bullish above $1,966

Technical levels

XAU/USD

Overview
Today last price1959.06
Today Daily Change0.56
Today Daily Change %0.03
Today daily open1958.5
 
Trends
Daily SMA201828.24
Daily SMA501771.32
Daily SMA1001713.87
Daily SMA2001622.59
 
Levels
Previous Daily High1981.34
Previous Daily Low1907.04
Previous Weekly High1906.68
Previous Weekly Low1805.86
Previous Monthly High1785.91
Previous Monthly Low1670.76
Daily Fibonacci 38.2%1952.96
Daily Fibonacci 61.8%1935.42
Daily Pivot Point S11916.58
Daily Pivot Point S21874.66
Daily Pivot Point S31842.28
Daily Pivot Point R11990.88
Daily Pivot Point R22023.26
Daily Pivot Point R32065.18

Author

Omkar Godbole

Omkar Godbole

FXStreet Contributor

Omkar Godbole, editor and analyst, joined FXStreet after four years as a research analyst at several Indian brokerage companies.


More from Omkar Godbole
Share:

Editor's Picks

GBP/USD flat lines around mid-1.3300s vs USD amid Iran tensions

The GBP/USD pair struggles to capitalize on last week's strong move higher and oscillates in a narrow band, around the 1.3350 area during the Asian session on Monday. Moreover, spot prices remain below a technically significant 200-day Simple Moving Average, warranting caution before positioning for an extension of the recent recovery from the 1.3140 zone, or the year-to-date low touched in June.


EUR/USD consolidates below mid-1.1400s as Hormuz risks support safe-haven USD

The EUR/USD pair kicks off the new week on a subdued note and oscillates in a narrow band below mid-1.1400s during the Asian session. Spot prices, however, remain within striking distance of a nearly two-week high, touched last Thursday, amid mixed fundamental cues.


Gold recaptures 21-day SMA, but sellers refuse to give up yet

Gold stalls its recent recovery just above $4,200 early Monday, as the Strait of Hormuz risks lurk. The US Dollar rebounds on renewed haven demand and the USD/JPY advance. Gold finds acceptance above the 21-day SMA, but the daily RSI remains bearish.

Steady recovery in Bitcoin nears key resistance – PUMP and HYPE lead gains

Bitcoin steadies above $63,000 at press time on Monday following a five-day recovery stretch last week, totaling roughly 7% gains. Easing risk-off sentiment in the broader market supports the mild recovery in action, with Pump.fun and Hyperliquid leading gains over the last 24 hours.

Why central banks are loading up on Gold during the current 30% correction
Gold has crashed from $5,500 to $4,000 in five months, marking a decline of almost 30% that has triggered widespread retail panic. However, this correction could present a significant opportunity, driven by an unprecedented market indicator: central bankers and the world's largest asset managers are aggressively buying.
Kevin Warsh offers no policy clues: Why markets still got their answer

Financial markets came to Sintra looking for clues about the Federal Reserve's (Fed) next move. They largely left with confirmation that Fed Chair Kevin Warsh intends to make those clues much harder to find.















