|

Gold Price Analysis: Recapturing $1,961 critical to recovery after sell-off – Confluence Detector

The gold sell-off continues – well after the precious metal lost the $2,000 level. As US bond yields rise, gold becomes less attractive. More importantly, traders who sent the stock all the way to a record high of $2,075 may now be taking profits to the bank. Sino-American tensions, fiscal stimulus speculation, and coronavirus figures are all eyed.

If Democrats and Repbulcians return to the negotiating table ond a put a large package on it, gold could surge. The yellow metal needs more funds – whether monetary stimulus or fiscal one.

How is XAU/USD technically positioned?

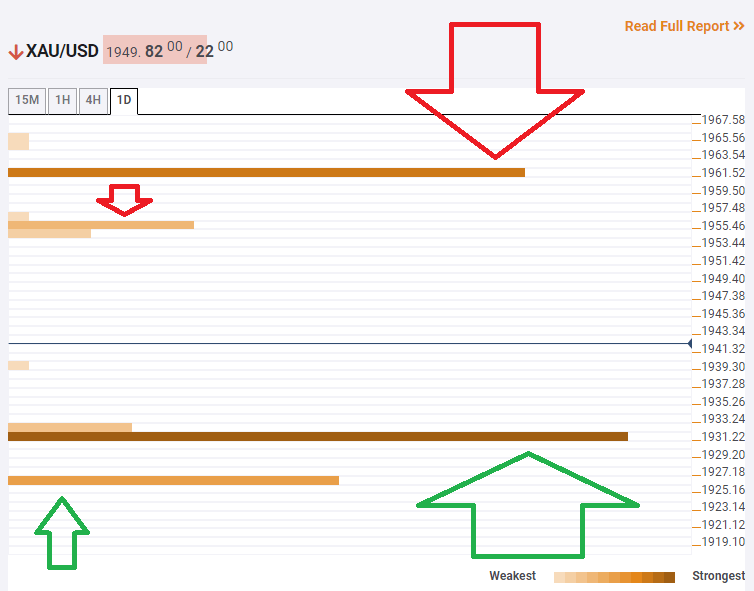
The Technical Confluences Indicator is showing that gold has significant support at $1,931, which is where the all-important Fibonacci 23.6% one-month and the previous 15-min low converge.

The next cushion is at $1,925, which is where the Bollinger Band one-day Middle hits the price.  

Looking up, minor resistance awaits at $1,955, which is a confluence line including the Simple Moving Average 100-4h, the BB 15min-Lower, and the previous 1h-low. 

A more significant hurdle – critical to gold's recovery – is $1,961 which is where the SMA 5-15m meets the crucial previous weekly low. 

Key XAU/USD resistances and supports

Confluence Detector

The Confluence Detector finds exciting opportunities using Technical Confluences. The TC is a tool to locate and point out those price levels where there is a congestion of indicators, moving averages, Fibonacci levels, Pivot Points, etc. Knowing where these congestion points are located is very useful for the trader, and can be used as a basis for different strategies.

Learn more about Technical Confluence

Author

Yohay Elam

Yohay Elam

FXStreet

Yohay is in Forex since 2008 when he founded Forex Crunch, a blog crafted in his free time that turned into a fully-fledged currency website later sold to Finixio.

More from Yohay Elam
Share:

Editor's Picks

EUR/USD appears supported by the 200-day SMA, for now

Following an early pullback to multi-week lows near 1.1670, EUR/USD now manages to reclaim the 1.1700 region as the NA session draws to a close on Monday. The steep retracement in spot follows the equally strong move higher in the US Dollar, as investors continue to assess the geopolitical landscape in the wake of the US and Israel attacks on Iran.


GBP/USD hits new yearly lows near 1.3300

GBP/USD adds to the recent bearish tone, approaching to the key 1.3300 support to reach fresh YTD troughs against the backdrop of the robust performance of the US Dollar. Indeed, Cable’s decline comes amid the firm demand for the safe-haven space in the wake of the US and Israel attacks to Iran.

Gold eases some ground, approaches $5,300

Gold now surrenders part of the earlier advance, reshifting its attenton to the $5,300 zone per troy ounce at the beginning of the week. Indeed, the yellow metal’s firm performance appears propped up by incresing geopolitical jitters in the Middle East, which at the same time fuels the demand for the safe-haven space.

Strategy lifts holdings to 3.4% of Bitcoin's total supply amid inflows into crypto products

Strategy continued its accumulation of the top crypto last week, acquiring 3,015 BTC for $204 million amid renewed interest in crypto products after four weeks of outflows.

The Fed is finally talking about AI – Here's why it matters for the US Dollar

AI is moving from earnings calls into the heart of monetary policy discussions, forcing Federal Reserve officials to confront a new question: How to act if AI reshapes inflation, employment and interest rates at the same time?

Grass 20% bullish breakout defies broader market weakness

Grass (GRASS) is edging up above $0.30 at the time of writing on Monday. The token’s notable 20% intraday surge stands out amid heightened volatility in the broader crypto market.