Gold Price Analysis: On the back foot below $1,600 inside falling channel
- Gold prices fail to hold onto the previous day’s recovery gains.
- 200-bar SMA, 61.8% Fibonacci retracement guard immediate upside.
- Bearish MACD keeps sellers hopeful.

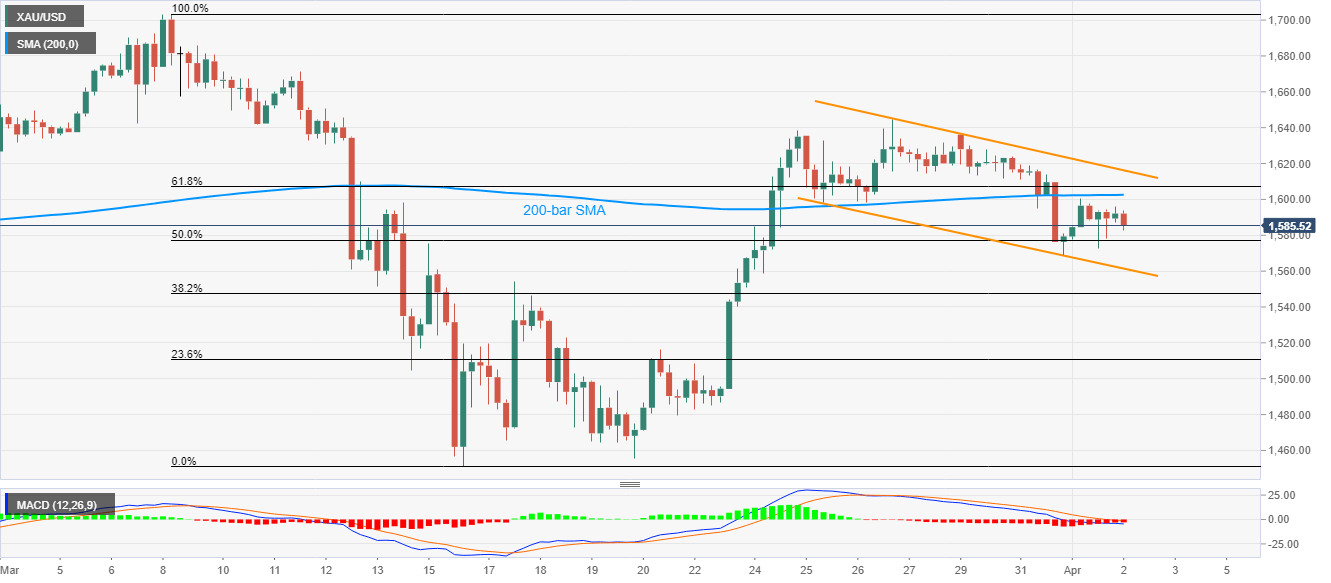
While defying Wednesday’s recovery moves, Gold prices drop to $1,585, down 0.40%, amid the early Thursday’s trading session.
In doing so, the yellow metal remains inside a one-week-old descending trend channel while also staying below 200-bar SMA and 61.8% Fibonacci retracement of its March 09-16 declines.
That said, the bullion sellers also take clues from the bearish MACD while currently targeting 50% Fibonacci retracement near $1,577. Though, the channel’s support, around $1,561, could question further downside.
On the flip side, 200-bar SMA level of $1,603 precedes $1,607 resistance comprising 61.8% Fibonacci retracement.
During the metal’s further advances past-$1,607, the said channel’s upper line, close to $1,616 will be the key to watch.
Gold four-hour chart
Trend: Further weakness expected
Author

Anil Panchal
FXStreet
Anil Panchal has nearly 15 years of experience in tracking financial markets. With a keen interest in macroeconomics, Anil aptly tracks global news/updates and stays well-informed about the global financial moves and their implications.


