|

Gold Price Analysis: Bulls setting up for upside extension to -61.8% Fibo/$1,817/20

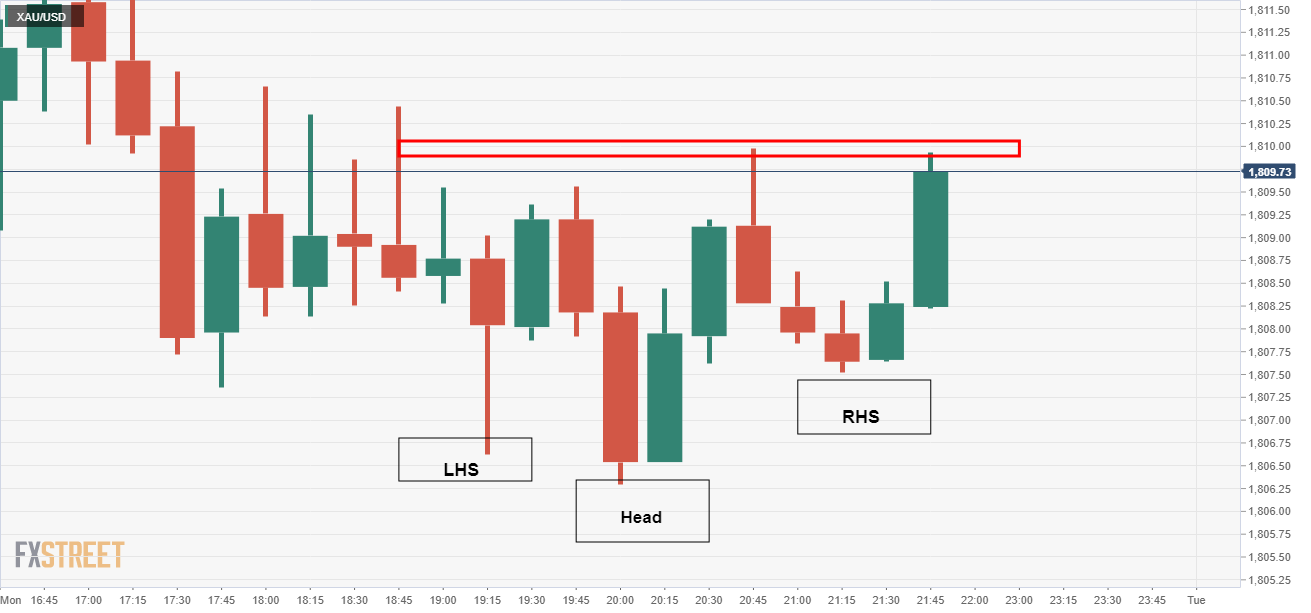
  • Gold is consolidating the recent bullish impulse, but the 15-min reverse H&S is an extra conviction for prospects of a continuation.
  •  $1,817 and $1,820 are on the bulls map.

As per the prior analysis from the New York session, Gold Price Analysis: Bulls target $1,820, 1-hour Momentum points to meanwhile correction, the yellow metal did indeed decelerate to a measured target of the 38.2% Fibonacci retracement level. 

Prior analysis

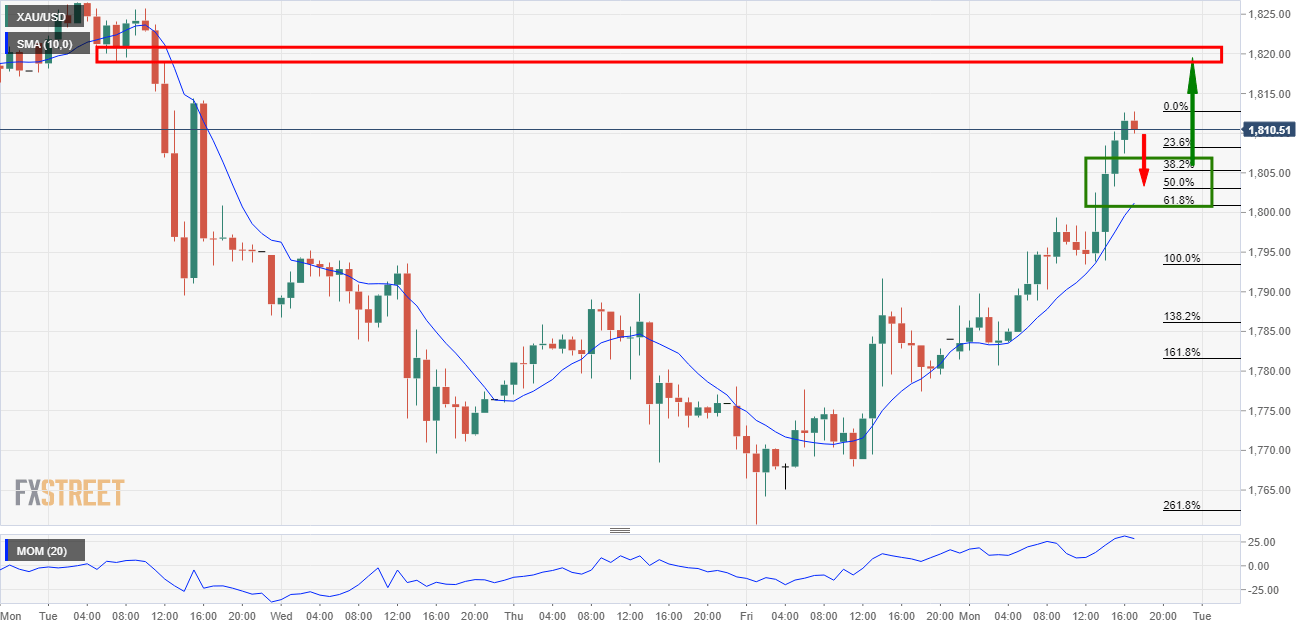
Live market, 1-hour chart

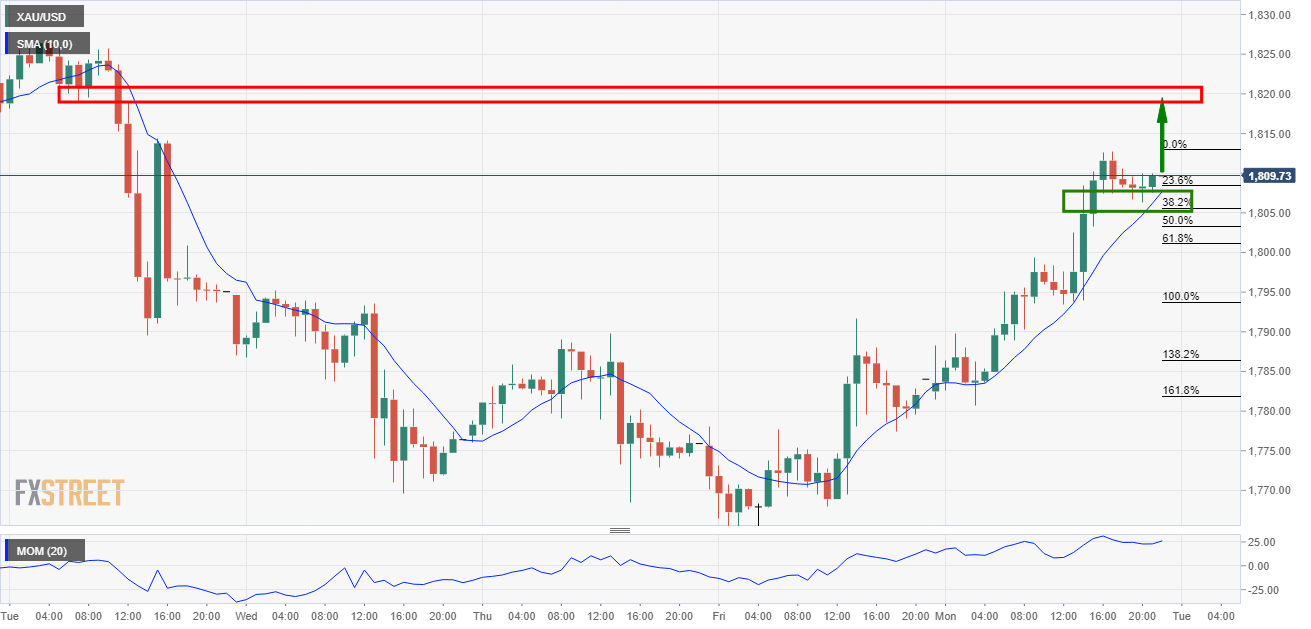
The bulls can seek an optimal entry for a continuation at this juncture from a lower time frame, such as the 15 or 5-minute charts. 

15-chart setup

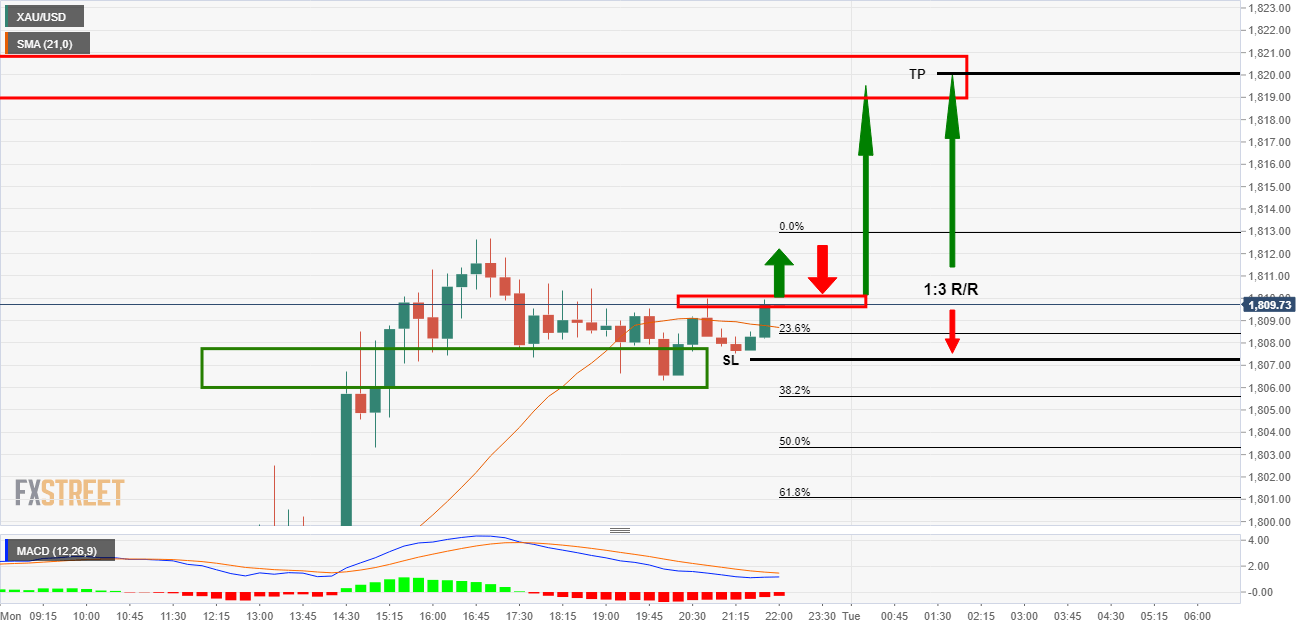
As illustrated on the 15-min chart, the price first needs to break the current resistance to confirm the bullish environment and commitment from the bulls at this juncture.

In doing so, this will have completed a bullish reverse head and shoulders pattern: 

A buy limit placed at the new support structure, old resistance and neckline of the H&S pattern, will offer a discount.

This will enable the bulls to $1,820 target the upside with a stop loss protected by two layers of the support structure for a 1:3 risk to reward (R/R) long position. 

A more conservative target, however, comes as the -61.8% Fibonacci retracement of the current correction's range at $1,817 for a 1:2 R/R.

Author

Ross J Burland

Ross J Burland, born in England, UK, is a sportsman at heart. He played Rugby and Judo for his county, Kent and the South East of England Rugby team.

More from Ross J Burland
Share:

Editor's Picks

EUR/USD extends losses toward 1.1600 ahead of EU inflation data

EUR/USD extends the decline toward 1.1600 in the European session on Tuesday. The pair remains under pressure as surging energy prices amid the US-Iran war have increased the risks of higher inflation for the Old Continent. The focus is now on the Eurozone preliminary inflation reading for February. 

GBP/USD drops back toward three-month lows below 1.3350

GBP/USD is back in the red, accelerating its downside toward the three-month lows of 1.3315 in European trading on Tuesday. The ongoing escalation in the Iran war, combined with rising Oil prices, weighs negatively on the higher-yielding Pound Sterling as the US Dollar preserves the previous upside. 

Gold weakens below $5,300 as sustained USD buying counter Middle East tensions

Gold attracts some intraday selling and falls around $100 from the daily top, around the $5,380 area. The US Dollar climbs to a fresh high since January 20 and turns  out to be a key factor exerting downward pressure on the commodity. However, concerns about a broader regional conflict in the Middle East continue to weigh on investors' sentiment and underpin demand for the traditional safe-haven bullion.

Stellar risks deeper losses as derivatives metrics turn negative

Stellar is trading red below $0.16 at the time of writing on Tuesday, after a slight recovery the previous day. Weakening derivatives data caps the recovery, while an unfavorable technical outlook projects a deeper correction for the XLM token in the upcoming days.

The market is not panicking it is repricing the probability distribution of Oil and time

At the end of the day, markets do not trade morality or geopolitics. They trade transmission channels. And the only channel that truly matters in this maelstrom runs through the price of energy and the time value of money.

Hyperliquid Price Forecast: HYPE rises on commodities demand amid US-Iran war

Hyperliquid (HYPE) steadies above $33 at press time on Tuesday, marking its fourth consecutive day of recovery in a broadly volatile market due to the ongoing US-Israel strikes on Iran.