|

Gold Price Analysis: Bullish flag keeps XAU/USD buyers hopeful above $1,700

  • Gold stays depressed around intraday low, trims biggest gains since January.
  • Receding strength of bearish MACD, sustained trading beyond 200-SMA favor buyers.
  • Buyers need to stay cautious despite confirming the bullish chart pattern unless crossing $1,765.

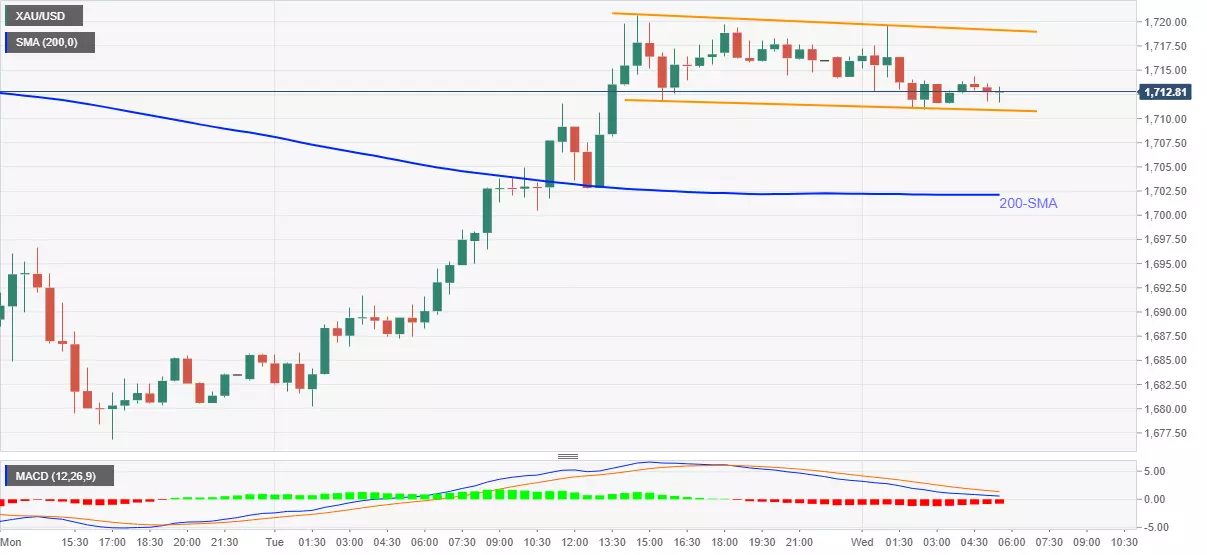
Gold remains pressured around $1,713, down 0.18% intraday, ahead of Wednesday’s European session. Although the bullion fades upside momentum after the heaviest run-up in two months, it does portray a bullish chart formation, called bullish flag, on the 30-minutes (30M).

Not only the bullish chart pattern but the commodity’s successful trading above 200-SMA as well as receding strength of the bearish MACD also favor gold buyers.

However, a clear upside break of $1,720 becomes necessary before directing the bulls towards confronting November 2020 lows near $1,765. During the rise, $1,740 can offer an intermediate halt.

Meanwhile, a downside break below the stated flag’s support, at $1,710 now, will have to slip beneath the 200-SMA level of $1,702, as well as the $1,700 threshold, to confirm refreshing the latest multi-day low around $1,676.

Overall, gold consolidates recent gains ahead of the key US stimulus decision but the bullish chart pattern keeps the case interesting.

Gold 30-minute chart
Trend: Further recovery expected

additional important levels

Overview
Today last price1712.71
Today Daily Change-3.53
Today Daily Change %-0.21%
Today daily open1716.24
 
Trends
Daily SMA201765.57
Daily SMA501822.03
Daily SMA1001844.46
Daily SMA2001859.76
 
Levels
Previous Daily High1720.7
Previous Daily Low1680.24
Previous Weekly High1759.98
Previous Weekly Low1687.37
Previous Monthly High1871.9
Previous Monthly Low1717.24
Daily Fibonacci 38.2%1705.24
Daily Fibonacci 61.8%1695.7
Daily Pivot Point S11690.75
Daily Pivot Point S21665.27
Daily Pivot Point S31650.29
Daily Pivot Point R11731.21
Daily Pivot Point R21746.19
Daily Pivot Point R31771.67

Author

Anil Panchal

Anil Panchal

FXStreet

Anil Panchal has nearly 15 years of experience in tracking financial markets. With a keen interest in macroeconomics, Anil aptly tracks global news/updates and stays well-informed about the global financial moves and their implications.


More from Anil Panchal
Share:

Editor's Picks

GBP/USD advances to three-month peak beyond 1.3600

GBP/USD extends its daily rally and trades at its highest level since mid-May above 1.3600. The US Treasury Department decision to double the sice of liquidity support buyback operations for longer-dated nominal coupon securitiez weighs heavily on the US Dollar and helps the pair push higher. Earlier in the day, the data from the UK showed that annual Consumer Price Index (CPI) inflation picked up to 2.9% in July, meeting estimates, while core CPI rose by 2.6% YoY in July versus 2.5% expected.

EUR/USD surges to 11-week high above 1.1650 after US Treasury announcement

EUR/USD gathers bullish momentum and trades at its highest level since early June above 1.1650 on Wednesday. The US Dollar stays under heavy bearish pressure after the US Treasury announced that it will increase the size of liquidity support buyback operations for longer-dated nominal coupon securities. Later in the day, investors will scrutinize FOMC Minutes for fresh clues on policy outlook.

Gold climbs 2% as US Treasury buyback plan pressures long-term yields

Gold (XAU/USD) enters Wednesday’s American trading hours with decent intraday gains, as a softer US Dollar (USD) and a sharp pullback in long-term US Treasury yields help the metal recover all the previous day’s losses.

Australia unemployment rate expected to hold at 4.4% in July
Australia will release the July monthly employment report on Thursday at 01:30 GMT. Ahead of the announcement, analysts anticipate a modest 15K increase in job creation, while the Unemployment Rate is expected to remain steady at 4.4%.
WTI Oil climbs as US-Iran standoff keeps Middle East supply risks elevated
West Texas Intermediate (WTI) Oil holds firm on Wednesday, hovering near its highest level in more than three weeks as traders balance Middle East supply risks against rising US crude inventories. At the time of writing, the US benchmark trades around $85.20 per barrel, up nearly 1% on the day.
Why is Crude Oil priced for a reopening the ships haven't made?
Fourteen vessels crossed the Strait of Hormuz on Tuesday. Before the war, the count ran near 120 a day. In the sessions since the waterway was publicly declared open, Brent has drifted back to $87 and West Texas Intermediate (WTI) to $81, both a little lower again on Wednesday, with daily momentum on each unwound from the top of its range in late July to the low twenties now.