Gold appreciates as geopolitical risks intensify
- Gold demand increases from investors bundling into safety as geopolitical risks escalate.
- Israel’s threat of “all-out war” with Lebanon and Russia’s signing of an alliance with North Korea are intensifying concerns.
- XAU/USD recovers and reaches a cross-roads level, bringing its ongoing bearish pattern into question.

Gold (XAU/USD) price awakens from its slumber on Thursday, gaining a sprightly half a percent to trade in the $2,330s, and finds itself at a technical crossroads that could define the directional trend for the rest of the summer.
The market mood is placid going into the European session, with Asian bourses showing either mild gains or tepid losses. That said, Gold sees gains from safety demand as the geopolitical global threat level lights up another bar and global powers move their chess pieces across the world’s strategic chequered board.
Gold gains as geopolitical threat level rises a notch
Safe-haven Gold sees demand pick up as investors cast a worrying eye over intensifying geopolitical events on the world stage.
In the Middle East, tensions between Israel and Lebanon reached boiling point on Wednesday after Israeli officials warned they had approved plans for the Northern Command to launch an “all-out war” with Hezbollah in Lebanon.
The threat came in response to the release of drone footage by Hezbollah chief Hassan Nasrallah, showing nine minutes of aerial footage of the docks in Israel’s port city of Haifa, which are operated by foreign companies from China and India, reported Aljazeera News.
A full-frontal assault by Israel would represent a significant escalation of the conflict in the region, something US diplomats are working to avoid. Lebanon has been engaged in border skirmishes and traded missile attacks with Israel since the start of Israel’s invasion of Gaza.
Russia and China make strategic moves
Gold also sees gains as investors note concerning events further east. On Wednesday, Russian President Vladimir Putin signed a pact with North Korean leader Kim Jong Un that ensures either country will support the other in the case they are attacked.
Malaysia also announced on Wednesday its plans to join the BRICS trading federation before a meeting between its Prime Minister Anwar Ibrahim and Premier Li Qiang of China. In May, Thailand also announced plans to join the BRICS.
The growing power of BRICS as a counterweight to Western and US dominance is concerning some global strategists as it risks fracturing the smooth flow of world trade.
Technical Analysis: Gold reaches technical crossroads
Gold rallies up to a key resistance level at a trendline and the 50-day Simple Moving Average (SMA), situated at around $2,340. XAU/USD has reached a technical crossroads that could determine the directional trend for some time to come.
A decisive break above the cluster of resistance would invalidate the bearish Head-and-Shoulders (H&S) pattern that has been forming on the daily chart.
A deceive break would be one accompanied by a long green bullish daily candle that pierced cleanly through the resistance and closed near its high, or three consecutive bullish candles that broke above the level.
Such a break would invalidate the bearish H&S and indicate a continuation of Gold’s broader uptrend higher, probably to an initial target in the mid $2,380s (June 7 high).
XAU/USD Daily Chart
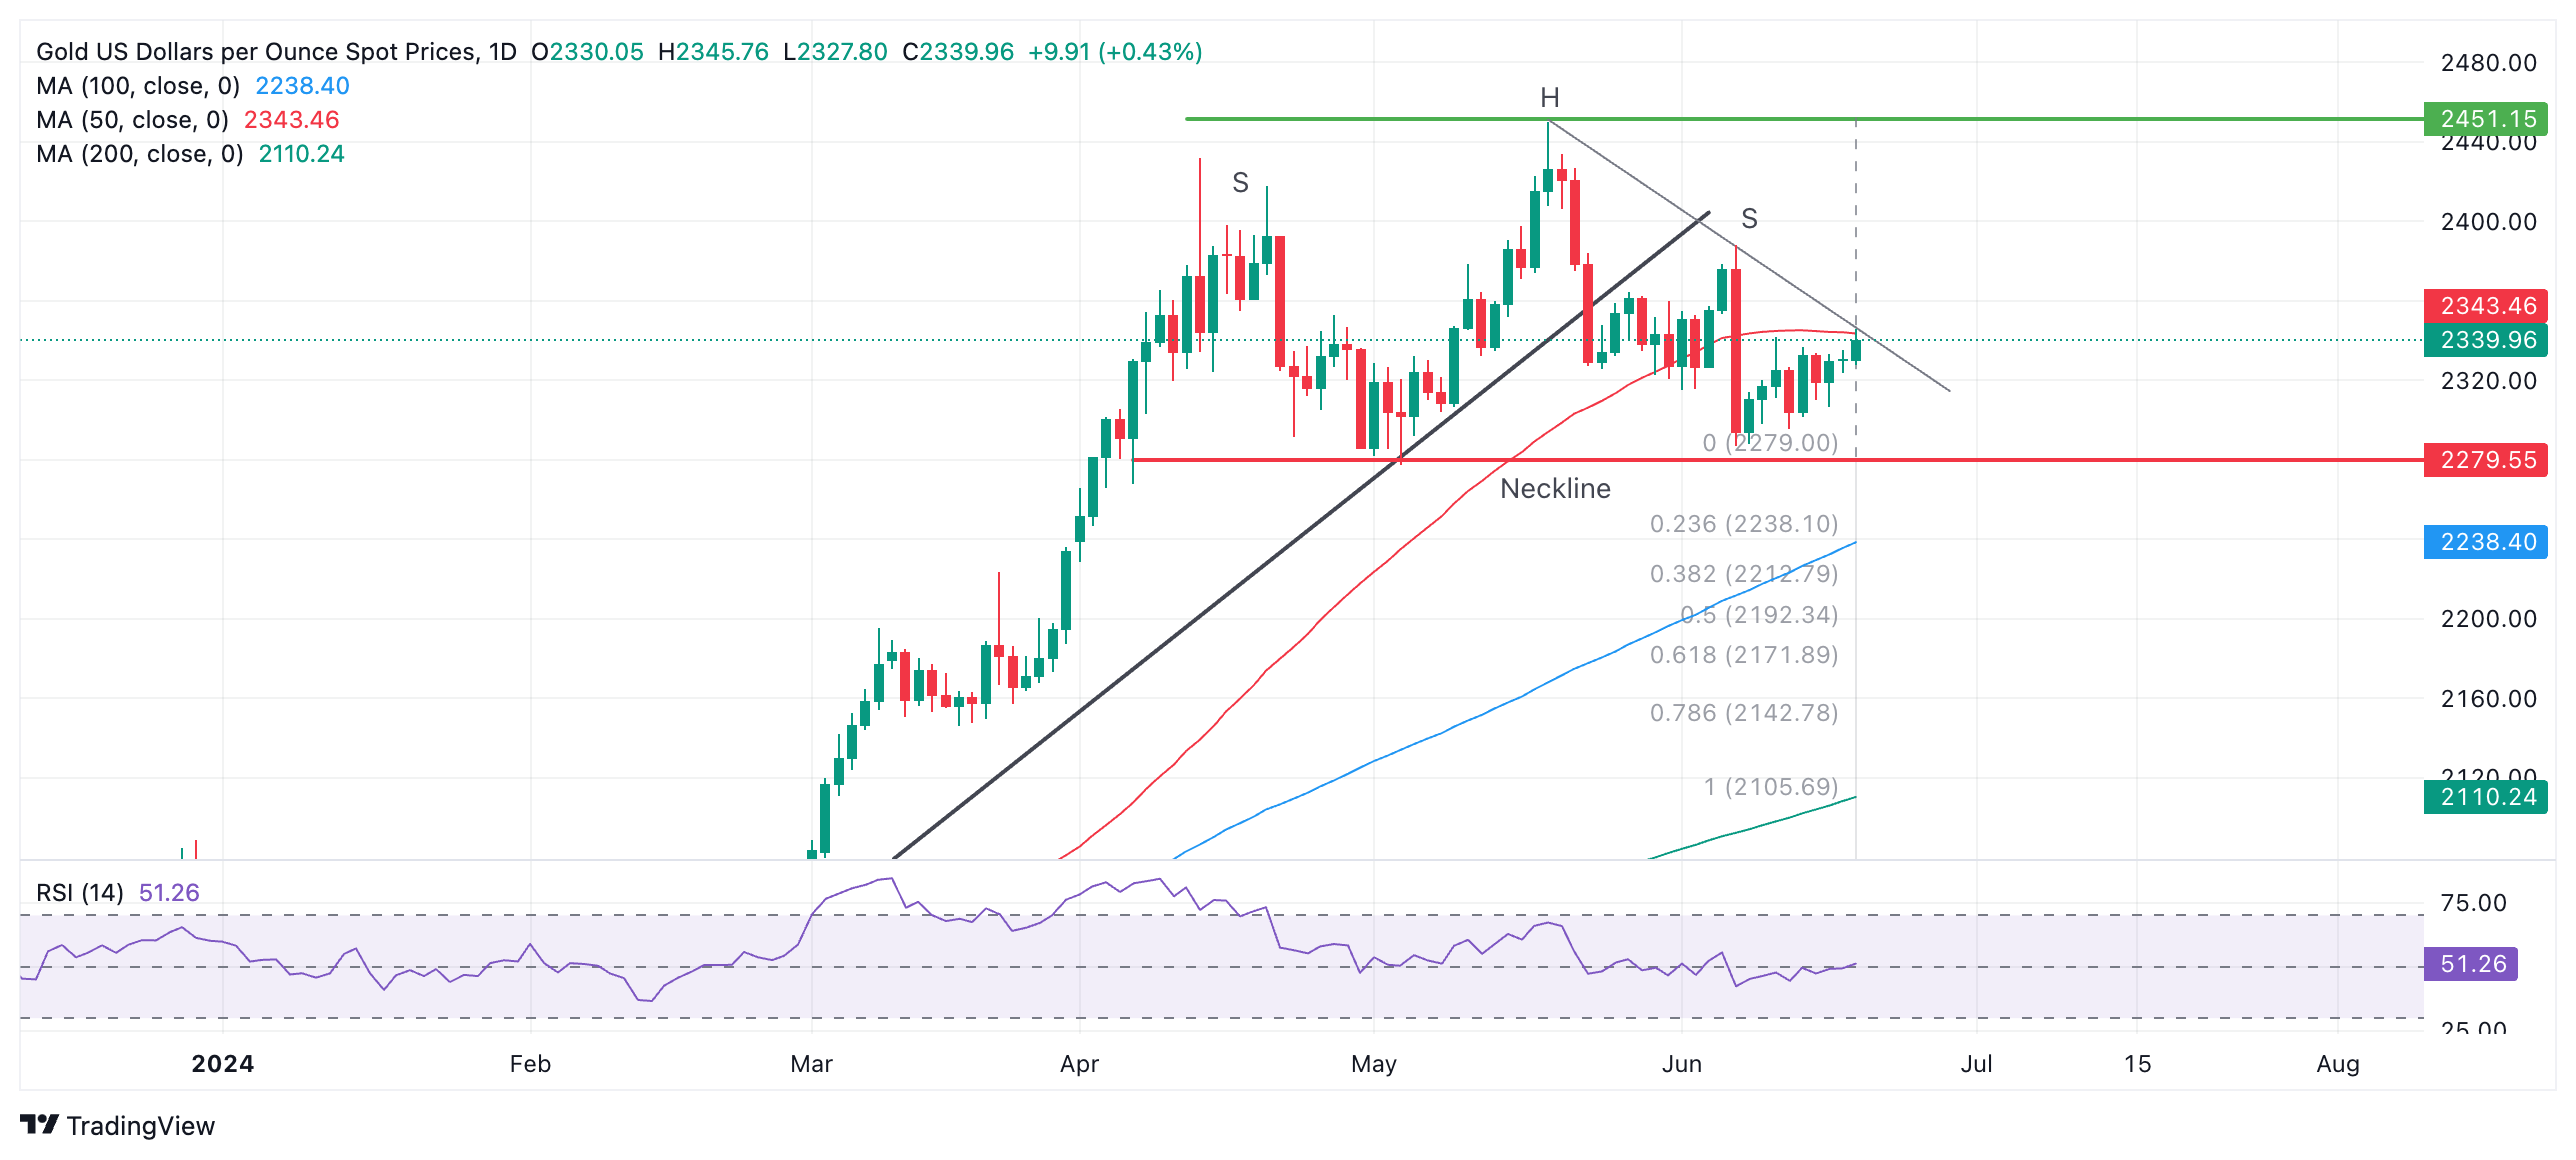
However, a failure to break above would continue to support the possibility that Gold is forming an H&S reversal pattern. Such patterns tend to occur at market tops and signal a change of trend.
The H&S on Gold has completed a left and right shoulder (labeled “S”) and a “head” (labeled “H”). The so-called “neckline” of the pattern appears to be at the $2,279 support level (red line).
A decisive break below the neckline would validate the H&S pattern and activate downside targets. The first more conservative target would be $2,171, calculated by taking the 0.618 Fibonacci ratio of the height of the pattern and extrapolating it lower from the neckline. The second target would be at $2,106, the full height of the pattern extrapolated lower.
A break above $2,345, however, would bring the H&S into doubt and could signal a continuation higher, to an initial target at the $2,450 peak.
Interest rates FAQs
Interest rates are charged by financial institutions on loans to borrowers and are paid as interest to savers and depositors. They are influenced by base lending rates, which are set by central banks in response to changes in the economy. Central banks normally have a mandate to ensure price stability, which in most cases means targeting a core inflation rate of around 2%. If inflation falls below target the central bank may cut base lending rates, with a view to stimulating lending and boosting the economy. If inflation rises substantially above 2% it normally results in the central bank raising base lending rates in an attempt to lower inflation.
Higher interest rates generally help strengthen a country’s currency as they make it a more attractive place for global investors to park their money.
Higher interest rates overall weigh on the price of Gold because they increase the opportunity cost of holding Gold instead of investing in an interest-bearing asset or placing cash in the bank. If interest rates are high that usually pushes up the price of the US Dollar (USD), and since Gold is priced in Dollars, this has the effect of lowering the price of Gold.
The Fed funds rate is the overnight rate at which US banks lend to each other. It is the oft-quoted headline rate set by the Federal Reserve at its FOMC meetings. It is set as a range, for example 4.75%-5.00%, though the upper limit (in that case 5.00%) is the quoted figure. Market expectations for future Fed funds rate are tracked by the CME FedWatch tool, which shapes how many financial markets behave in anticipation of future Federal Reserve monetary policy decisions.
Author

Joaquin Monfort
FXStreet
Joaquin Monfort is a financial writer and analyst with over 10 years experience writing about financial markets and alt data. He holds a degree in Anthropology from London University and a Diploma in Technical analysis.


