|

GE Vernova Inc. (GEV) Elliott Wave forecast: Bullish trend resumes

GE Vernova Inc. (GEV) has been trending higher, and its Elliott Wave structure suggests the uptrend will continue. The recent pullback appears to be wave (II), setting the stage for a new bullish move.

Elliott Wave analysis

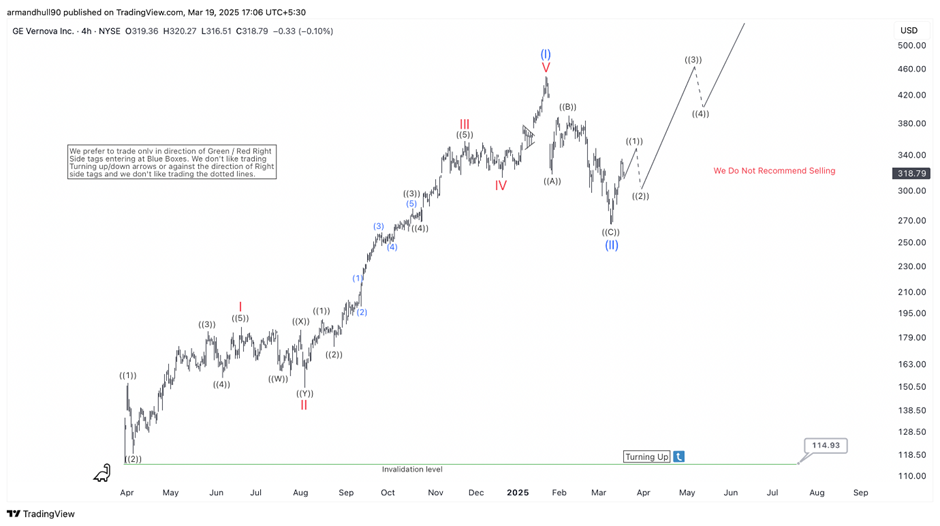
The chart shows a clear five-wave impulse to the upside, labeled as wave (I), which peaked earlier this year. After that, a corrective phase unfolded, completing wave (II) at a key support level of $266.08. This level aligns with the Fibonacci retracement zone, providing a strong base for the next bullish leg. Now, the stock is in the early stages of wave (III), which typically extends and sees the strongest price acceleration in an Elliott Wave cycle. The forecast suggests a move beyond the previous peak, with price targets in the $450–$500 range. Additionally, the presence of a “Turning Up” tag at the invalidation level at $114.93 reinforces the idea of a bullish continuation.

Chart

Right side and trading strategy

The right-side tag signals that traders should focus on long positions since the dominant trend remains bullish. The invalidation level at $114.93 serves as a risk management point. If the price falls below this level, the bullish count would need reevaluation. However, as long as it holds, the market structure favours further upside.

Conclusion

GE Vernova Inc. remains in a bullish Elliott Wave structure, with wave (III) in progress. Traders and investors should look for pullbacks as buying opportunities while keeping an eye on the invalidation level. The long-term outlook remains positive, with a potential breakout toward new highs in the coming months.

Author

Elliott Wave Forecast Team

Elliott Wave Forecast Team

ElliottWave-Forecast.com

More from Elliott Wave Forecast Team
Share:

Editor's Picks

EUR/USD deflates to fresh lows, targets 1.1600

The selling pressure on EUR/USD now gathers extra pace, prompting the pair to hit fresh multi-week lows in the 1.1625-1.1620 band on Friday. The continuation of the downward bias comes in response to further gains in the US Dollar as market participants continue to assess the mixed release of US Nonfarm Payrolls in December.

GBP/USD breaks below 1.3400, challenges the 200-day SMA

GBP/USD remains under heavy fire and retreats for the fourth consecutive day on Friday. Indeed, Cable suffers the strong performance of the Greenback, intensified post-mixed NFP, and trades at shouting distance from its critical 200-day SMA near 1.3380.

Gold flirts with yearly tops around $4,500

Gold keeps its positive bias on Friday, adding to Thursday’s advance and challenging yearly highs in the $4,500 region per troy ounce. The risk-off sentiment favours the yellow metal despite the firmer tone in the Greenback and rising US Treasury yields.

Crypto Today: Bitcoin, Ethereum, XRP risk further decline as market fear persists amid slowing demand

Bitcoin holds $90,000 but stays below the 50-day EMA as institutional demand wanes. Ethereum steadies above $3,000 but remains structurally weak due to ETF outflows. XRP ETFs resume inflows, but the price struggles to gain ground above key support.

Week ahead – US CPI might challenge the geopolitics-boosted Dollar

Geopolitics may try to steal the limelight from US data. A possible US Supreme Court ruling on tariffs could dictate market movements. A crammed data calendar next week, US CPI comes on Tuesday; Fedspeak to intensify.

XRP trades under pressure amid weak retail demand

XRP presses down on the 50-day EMA support as risk-averse sentiment spreads despite a positive start to 2026. XRP faces declining retail demand, as reflected in futures Open Interest, which has fallen to $4.15 billion.