GE Price Prediction: General Electric technical view, bounces from 50-day moving average
- GE slips post results release on Tuesday.
- General Electric shares fall to 50-day moving average support.
- Century-old engineering powerhouse beats on earnings per share but misses on revenue.

GE is a truly global player in the industrial space. It operates in the aircraft engine and leasing business, oil and gas production, as well as medical and finance sectors.
Stay up to speed with hot stocks' news!
GE stock forecast
GE reported earnings on Tuesday before the market open, beating the estimate for earnings per share (EPS). General Electric reported EPS of $0.03 against the forecast for $0.01. However, revenue came in slightly behind analyst forecasts at $17.12 billion versus $17.52 billion expected. GE reaffirmed its guidance for the remainder of 2021.
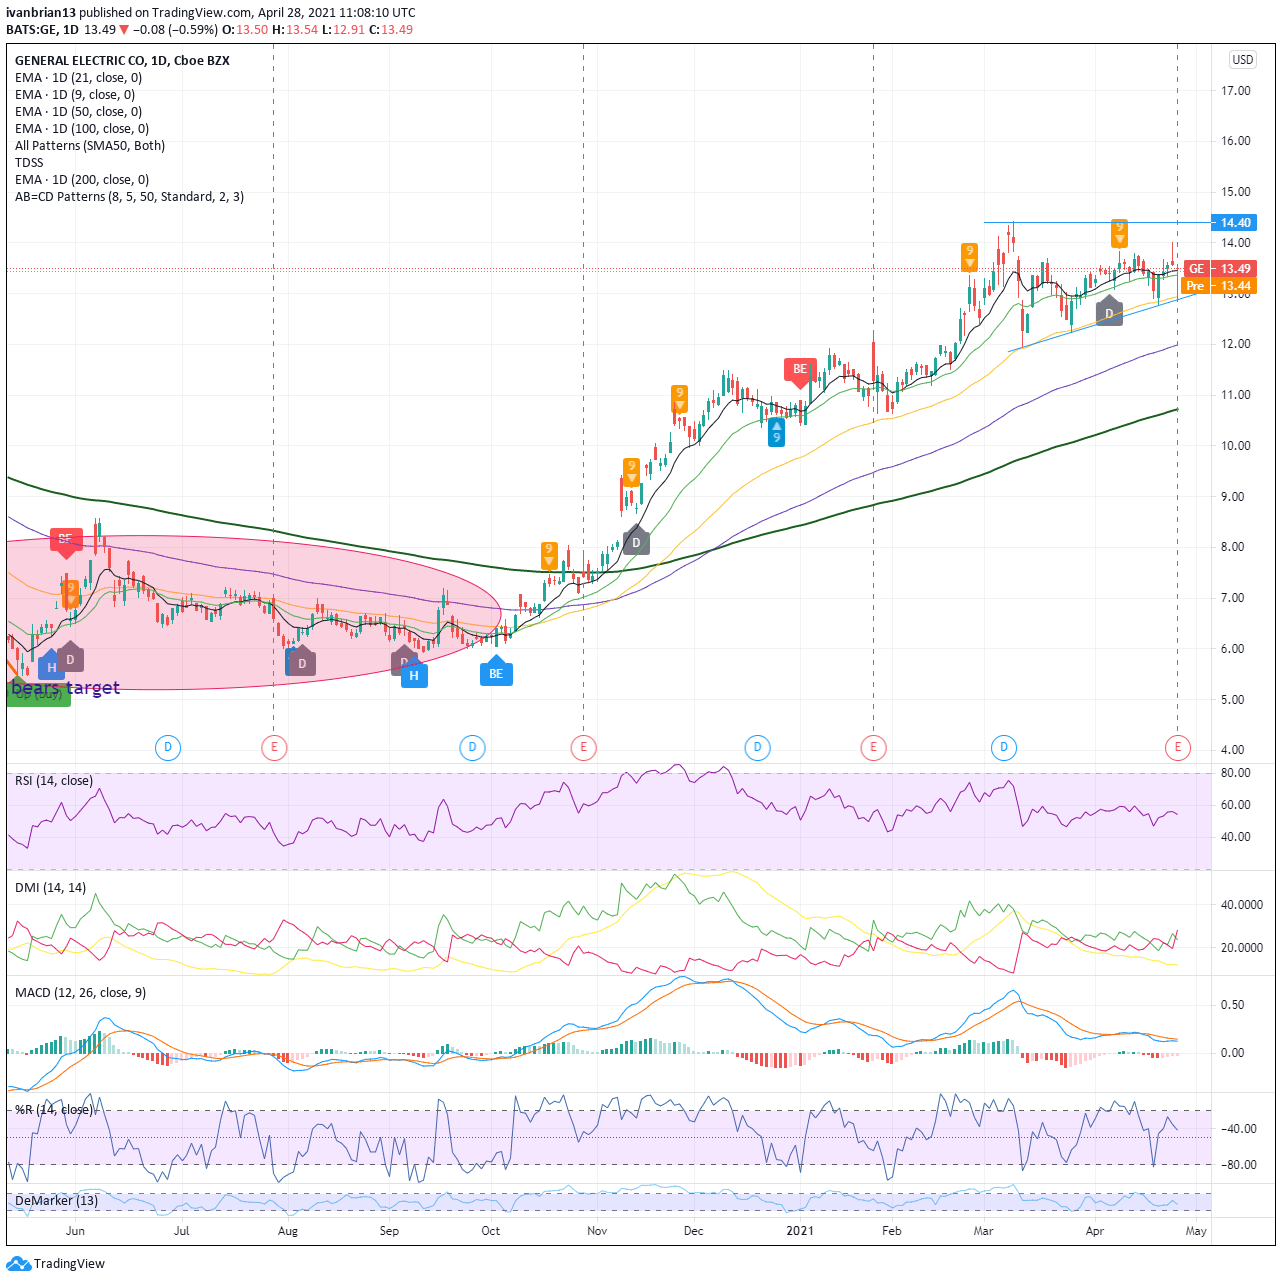
After the release, GE shares moved lower as investors focused on the disappointing revenue number. GE did exhibit some textbook chart analysis as the post-earnings sell-off stopped at the 50-day moving average support line. So this is a key area for GE to defend going forward to maintain the bullish momentum. This low also keeps in place the classic series of higher lows as evidenced by the uptrend support line. This line and the 50-day moving average provide nice entry levels for long positions with stops on a break below. The upside resistance is the 9 and 21-day moving averages at $13.37 and 13.46 and the previous high at $14.42.
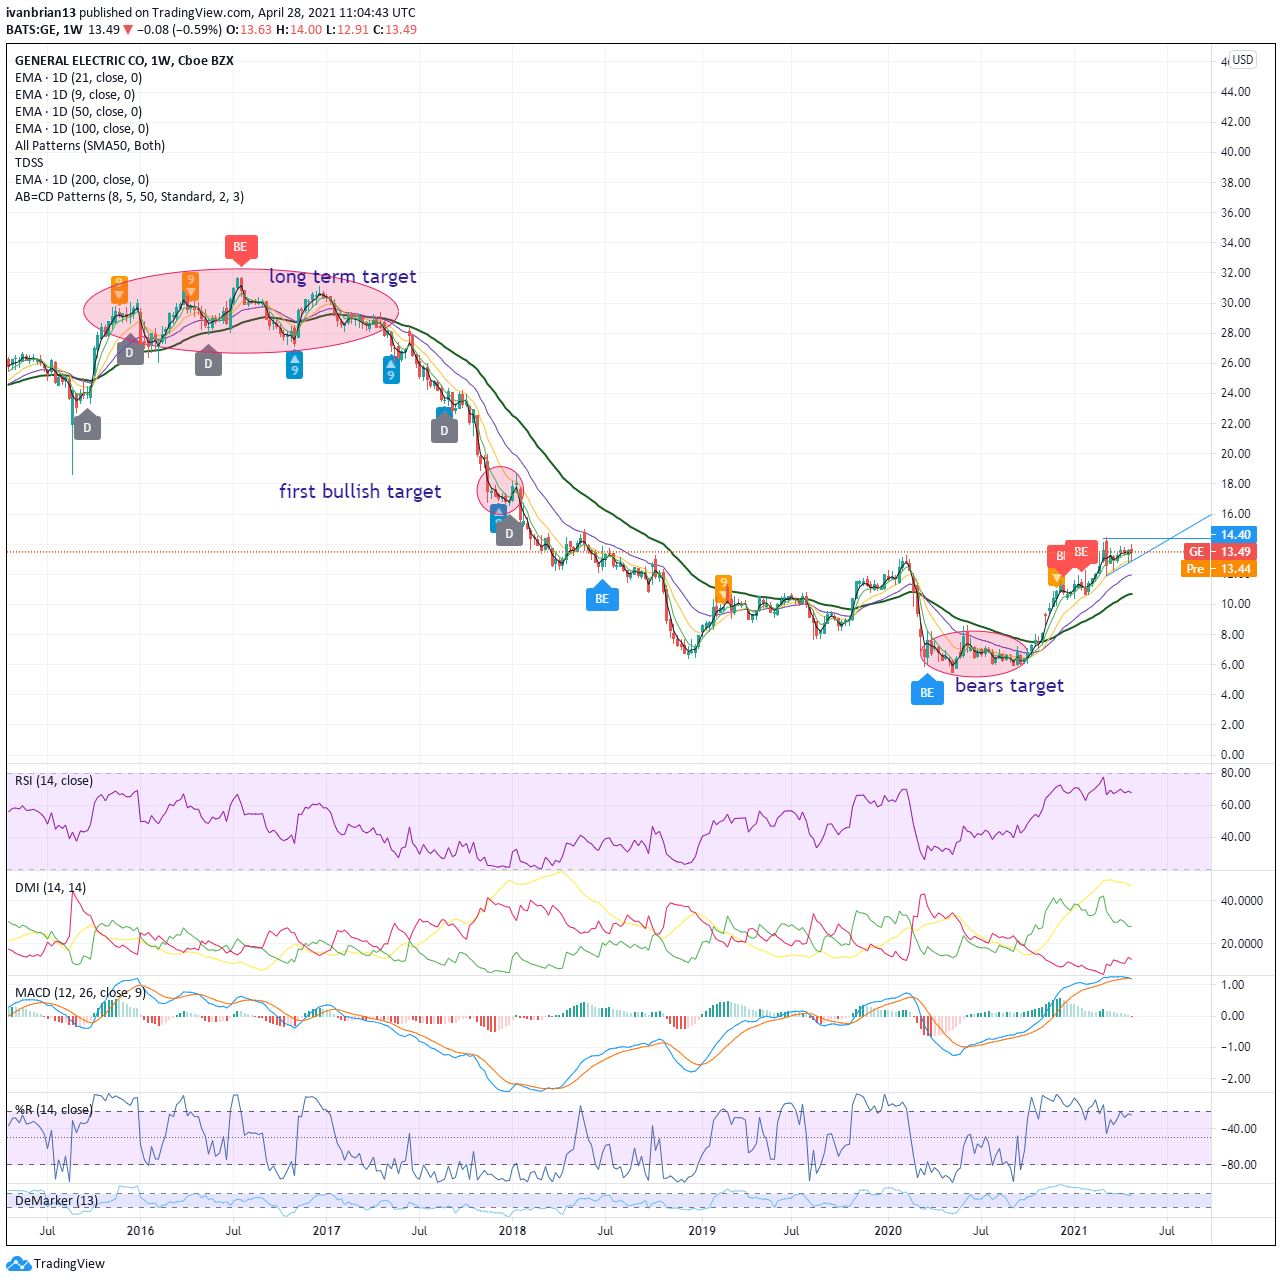
The longer-term chart shows resistance levels to target if GE can break the high at $14.42. The first area is the consolidation area in the red bubble as GE broke out quickly and sharply to the bottom of this bubble range back in January 2018. This is back toward $17 for GE. The ultimate aim is to get back to the long-term consolidation phase from October 2015 to April 2017 as the breakout was extremely bearish.
Failure will lead to bears targeting a return to the lower consolidation range from mid-2020.
We can see from the longer-term chart just how well the moving averages work to ensure you trade on the right side of the underlying trend. In particular, for a stock as liquid and common as GE, the 100-day works well for trading on the right side of long-term trends. The main area of concern on the longer-term chart is the potential crossover of the Moving Average Convergence Divergence (MACD). A break higher in price is needed to avoid this. The Directional Movement Index (DMI) is showing a strong bullish trend with the ADX line strong and the green positive line dominant, representing a bullish trend.
At the time of writing, the author has no position in any stock mentioned in this article and no business relationship with any company mentioned. The author has not received compensation for writing this article, other than from FXStreet.
This article is for information purposes only. The author and FXStreet are not registered investment advisors and nothing in this article is intended to be investment advice. It is important to perform your own research before making any investment and take independent advice from a registered investment advisor.
FXStreet and the author do not provide personalized recommendations. The author makes no representations as to accuracy, completeness, or the suitability of this information. FXStreet and the author will not be liable for any errors, omissions or any losses, injuries or damages arising from this information and its display or use. The author will not be held responsible for information that is found at the end of links posted on this page.
Errors and omissions excepted.
Premium
You have reached your limit of 3 free articles for this month.
Start your subscription and get access to all our original articles.
Author

Ivan Brian
FXStreet
Ivan Brian started his career with AIB Bank in corporate finance and then worked for seven years at Baxter. He started as a macro analyst before becoming Head of Research and then CFO.


