GBPUSD Price Analysis: Stays pressured inside bullish triangle ahead of UK employment data
- GBPUSD holds onto the previous day’s bearish bias but lacks downside momentum ahead of the key UK data.
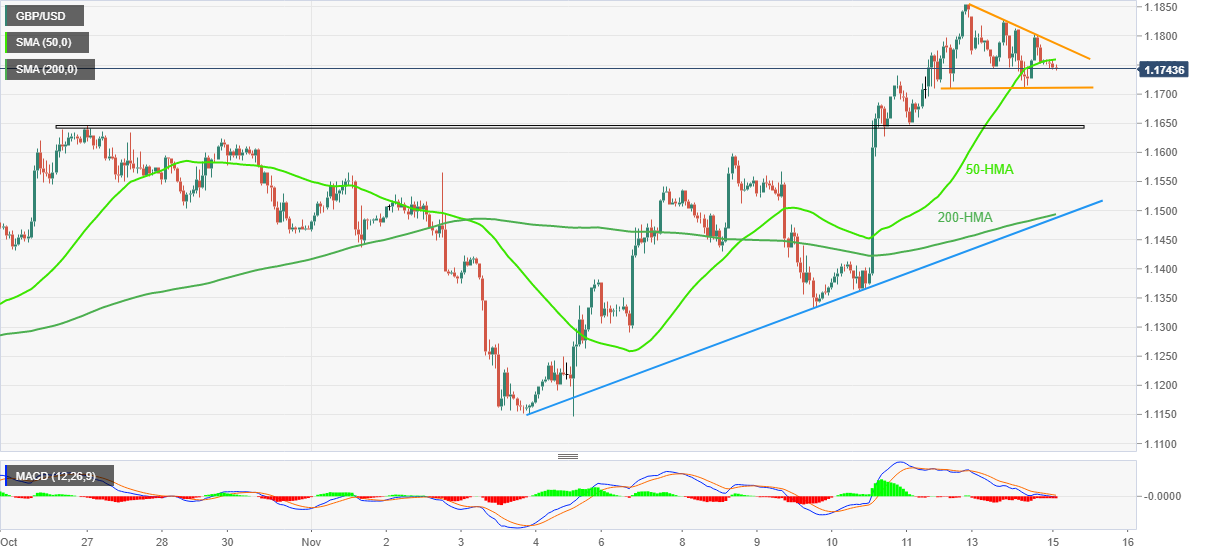
- Bearish MACD signals, downside break of the 50-HMA favor sellers.
- Further downside hinges of 1.1650-45 support break, bulls need to cross 1.1800 to retake control.

GBPUSD remains pressured around 1.1745, struggling to keep the bears hopeful despite extending the previous day’s pullback from an 11-week high, as the Cable pair stays inside a short-term descending triangle bullish chart pattern during early Tuesday in Asia.
That said, a clear downside break of the 50-HMA, around 1.1760 by the press time, directs GBPUSD towards the immediate triangle’s support line, close to 1.1710.
However, the GBPUSD pair’s downside past 1.1710 hinges on a three-week-old horizontal support area near 1.1650-45.
It should be noted that the GBPUSD weakness past 1.1645 might not hesitate to challenge the 1.1490-85 support confluence, comprising the 200-HMA and one-week-old ascending trend line.
Alternatively, an upside clearance of 1.1790 could confirm the bullish chart formation and can favor the GBPUSD buyers to challenge the monthly high surrounding 1.1855.
In the case GBPUSD remains firmer past 1.1855, the late August swing high near 1.1900 may offer an intermediate halt during the run-up towards August month’s peak near 1.2295.
Overall, GBPUSD remains on the buyers’ radar but a short-term pullback towards 1.1645 can’t be ruled out.
GBPUSD: Hourly chart
Trend: Limited downside expected
Author

Anil Panchal
FXStreet
Anil Panchal has nearly 15 years of experience in tracking financial markets. With a keen interest in macroeconomics, Anil aptly tracks global news/updates and stays well-informed about the global financial moves and their implications.


