GBP/USD - Widening of US-UK Yield differential to trigger a bearish breakdown?
- 10Y and 2Y US-UK yield differential rises in the GBP-negative manner despite upbeat UK GDP reading.
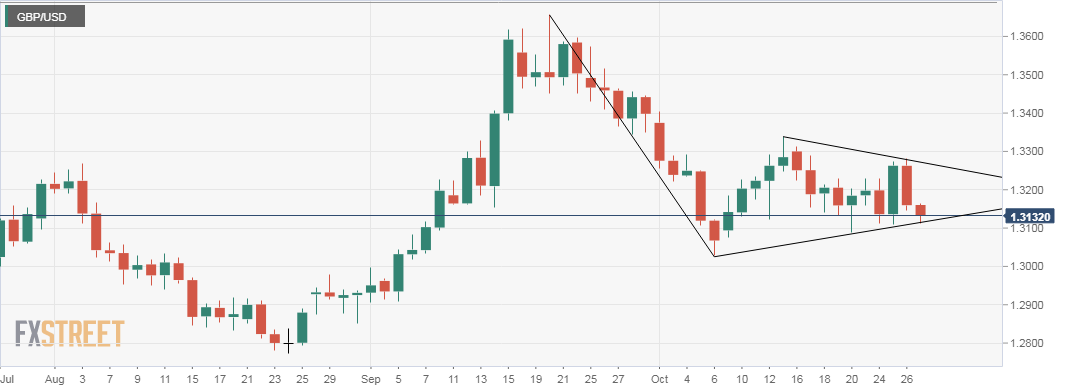
- GBP/USD fell to 1.3147 on Thursday and extended losses to 1.3113 in the Asian session today.
- The daily chart shows a symmetrical triangle pattern.

GBP/USD failed to capitalize on the Wednesday's bullish outside day candle yesterday as the bond yield differential turned a blind eye towards upbeat UK GDP reading and continued to rise in the GBP-negative manner.
Symmetrical triangle on the daily chart
The sell-off from the Sep. 20 high of 1.3657 ran out of steam at 1.3027 (Oct. 10 low). Since then the pair has moved in the sideways manner, setting higher lows and lower highs pattern i.e. symmetrical triangle formation.
A bearish breakdown (a break below triangle support of 1.3113) would signal continuation of the bearish move from 1.3657.
US-UK Yield differential continues to rise
Currently, the 2Y US-UK yield differential stands at 115 basis points; highest level since Sep. 1. Meanwhile, the 10Y US-UK yield differential hovers at 6-1/2 week high of 107 basis points. The yield spread is likely to rise further if the preliminary US Q3 GDP reading prints higher than expected, in which case the GBP/USD could suffer a bearish symmetrical triangle breakdown. On the other hand, a weaker-than-expected US GDP reading would help Cable regain poise.
GBP/USD Technical Levels
An end of the day close below 1.3113 would open doors for a sustained move lower to 1.30 (psychological level). A break lower could force bulls to unwind their shorts leading to a much deeper drop to 1.2839 (200-day MA). On the higher side, a move above 1.3162 (Asian session high) could yield 1.3189 (1-hour 200-MA) and 1.32 (zero levels).
Author

Omkar Godbole
FXStreet Contributor
Omkar Godbole, editor and analyst, joined FXStreet after four years as a research analyst at several Indian brokerage companies.