|

GBP/USD technical analysis: Upside remains capped by 1.2815/20

  • Immediate channel’s upper-line, 4H 200MA and May month extreme levels constitute upside resistance.
  • Break of the nearby channel can recall 1.2620 as a quote.

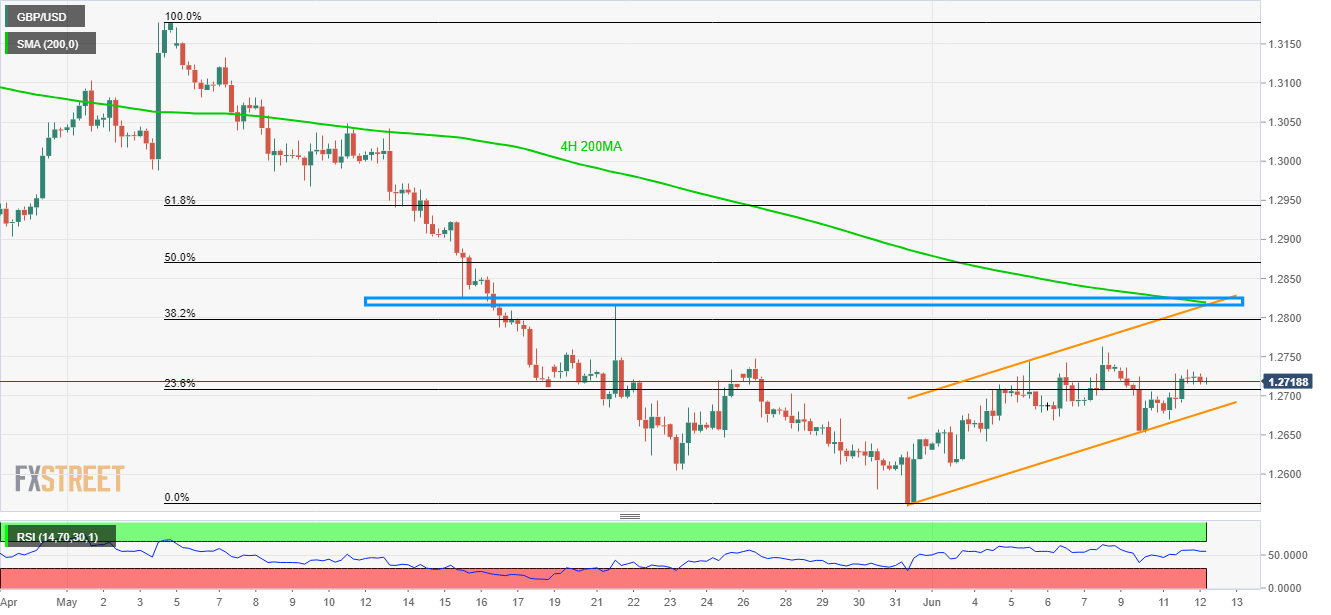
Despite lack of momentum, a 12-day long ascending trend-channel portrays the GBP/USD pair’s strength as it trades near 1.2720 ahead of the London open on Wednesday.

With this, the pair can keep being a strong contestant to aim for 1.2760/65 and 38.2% Fibonacci retracement level of 1.2800.

However, 200-bar moving average (4H 200MA), resistance-line of the channel and extreme levels of late-May could restrict the pair’s additional rise around 1.2815/20.

Should buyers dominate past-1.2820, 1.2900 and 61.8% Fibonacci retracement near 1.2945 could be their next bets.

On the downside break of channel support, at 1.2680, may trigger the pair’s pullback to 1.2655 and then to a recent low around 1.2620.

GBP/USD 4-Hour chart

Trend: Bearish

    1. R3 1.2811
    2. R2 1.2772
    3. R1 1.2748
  1. PP 1.2709
    1. S1 1.2685
    2. S2 1.2646
    3. S3 1.2621

Author

Anil Panchal

Anil Panchal

FXStreet

Anil Panchal has nearly 15 years of experience in tracking financial markets. With a keen interest in macroeconomics, Anil aptly tracks global news/updates and stays well-informed about the global financial moves and their implications.

More from Anil Panchal
Share:

Editor's Picks

EUR/USD treads water above 1.1850 amid thin trading

EUR/USD stays defensive but holds 1.1850 amid quiet markets in the European hours on Monday.  The US Dollar is struggling for direction due to thin liquidity conditions as US markets are closed in observance of Presidents' Day. 

GBP/USD flat lines as traders await key UK and US macro data

GBP/USD kicks off a new week on a subdued note and oscillates in a narrow range near 1.365 in Monday's European trading. The mixed fundamental backdrop warrants some caution for aggressive traders as the market focus now shifts to this week's important releases from the UK and the US.

Gold slides below $5,000 amid USD uptick and positive risk tone; downside seems limited

Gold attracts fresh sellers at the start of a new week and reverses a part of Friday's strong move up of over $150 from sub-$4,900 levels. The commodity slides back below the $5,000 psychological mark during the Asian session, though the downside potential seems limited amid a combination of supporting factors.

Bitcoin, Ethereum and Ripple consolidate within key ranges as selling pressure eases

Bitcoin and Ethereum prices have been trading sideways within key ranges following the massive correction. Meanwhile, XRP recovers slightly, breaking above the key resistance zone. The top three cryptocurrencies hint at a potential short-term recovery, with momentum indicators showing fading bearish signs.

Global inflation watch: Signs of cooling services inflation

Realized inflation landed close to expectations in January, as negative base effects weighed on the annual rates. Remaining sticky inflation is largely explained by services, while tariff-driven goods inflation remains limited even in the US.

Ripple Price Forecast: XRP potential bottom could be in sight

Ripple edges up above the intraday low of $1.35 at the time of writing on Friday amid mixed price actions across the crypto market. The remittance token failed to hold support at $1.40 the previous day, reflecting risk-off sentiment amid a decline in retail and institutional sentiment.