|

GBP/USD technical analysis: Heavy below 10-DMA, 2-week old resistance-line

  • Wednesday’s Doji-like candle on daily chart can’t portray GBP/USD strength unless breaking near-term key resistances.
  • Oversold RSI increases the odds for a pullback.

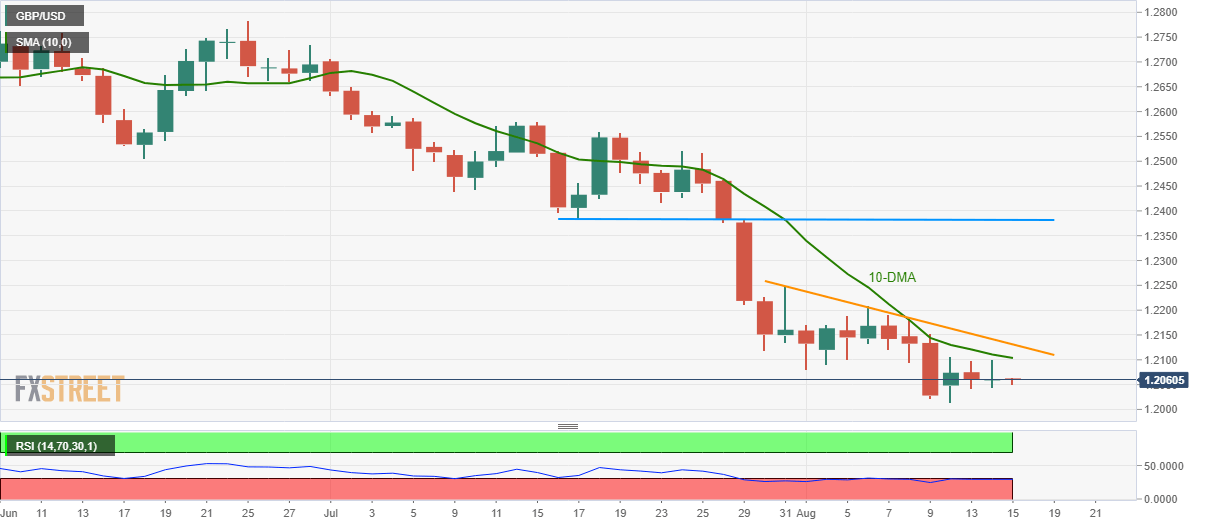
Despite forming similar to the ‘Doji’ candle on a daily chart, GBP/USD lags behind immediate upside barriers while taking rounds to 1.2060 during early Thursday.

The ‘Doji’ formation generally reverses the trend and is more influential when prices are low, as in the case of the Cable. Also supporting the recovery is oversold conditions of 14-bar relative strength index (RSI). Though, 10-day simple moving average (DMA) and a downward sloping trend-line since July 31 can keep the recovery in check around 1.2104 and 1.2131 respectively.

Should buyers successfully dominate beyond 1.2131, July 21 high near 1.2250 holds the key to the pair’s rise to 1.2382/84 horizontal-area comprising extremes of July 17 and 29.

Alternatively, 1.2015, 1.2000 and the 2017 low near 1.1987 could keep sellers busy ahead of pushing them towards 2016 low around 1.1806.

GBP/USD daily chart

Trend: Bearish

    1. R3 1.215 
    2. R2 1.2126 
    3. R1 1.2093 
  1. PP 1.2069 
    1. S1 1.2036
    2. S2  1.2012
    3. S3  1.198

Author

Anil Panchal

Anil Panchal

FXStreet

Anil Panchal has nearly 15 years of experience in tracking financial markets. With a keen interest in macroeconomics, Anil aptly tracks global news/updates and stays well-informed about the global financial moves and their implications.

More from Anil Panchal
Share:

Editor's Picks

EUR/USD treads water above 1.1850 amid thin trading

EUR/USD stays defensive but holds 1.1850 amid quiet markets in the European hours on Monday.  The US Dollar is struggling for direction due to thin liquidity conditions as US markets are closed in observance of Presidents' Day. 

GBP/USD flat lines as traders await key UK and US macro data

GBP/USD kicks off a new week on a subdued note and oscillates in a narrow range near 1.365 in Monday's European trading. The mixed fundamental backdrop warrants some caution for aggressive traders as the market focus now shifts to this week's important releases from the UK and the US.

Gold sticks to intraday losses; lacks follow-through

Gold remains depressed through the early European session on Monday, though it has managed to rebound from the daily trough and currently trades around the $5,000 psychological mark. Moreover, a combination of supporting factors warrants some caution for aggressive bearish traders, and before positioning for deeper losses.

Bitcoin, Ethereum and Ripple consolidate within key ranges as selling pressure eases

Bitcoin and Ethereum prices have been trading sideways within key ranges following the massive correction. Meanwhile, XRP recovers slightly, breaking above the key resistance zone. The top three cryptocurrencies hint at a potential short-term recovery, with momentum indicators showing fading bearish signs.

Global inflation watch: Signs of cooling services inflation

Realized inflation landed close to expectations in January, as negative base effects weighed on the annual rates. Remaining sticky inflation is largely explained by services, while tariff-driven goods inflation remains limited even in the US.

Ripple Price Forecast: XRP potential bottom could be in sight

Ripple edges up above the intraday low of $1.35 at the time of writing on Friday amid mixed price actions across the crypto market. The remittance token failed to hold support at $1.40 the previous day, reflecting risk-off sentiment amid a decline in retail and institutional sentiment.