|
GBP/USD technical analysis: Cable under pressure battling with the 1.2400 figure ahead of Fed’s Powell speech
- GBP/USD is under pressure at 27-month lows as the market is challenging 1.2400.
- Support is seen at 1.2390 and 1.2340 according to the Technical Confluences Indicator.

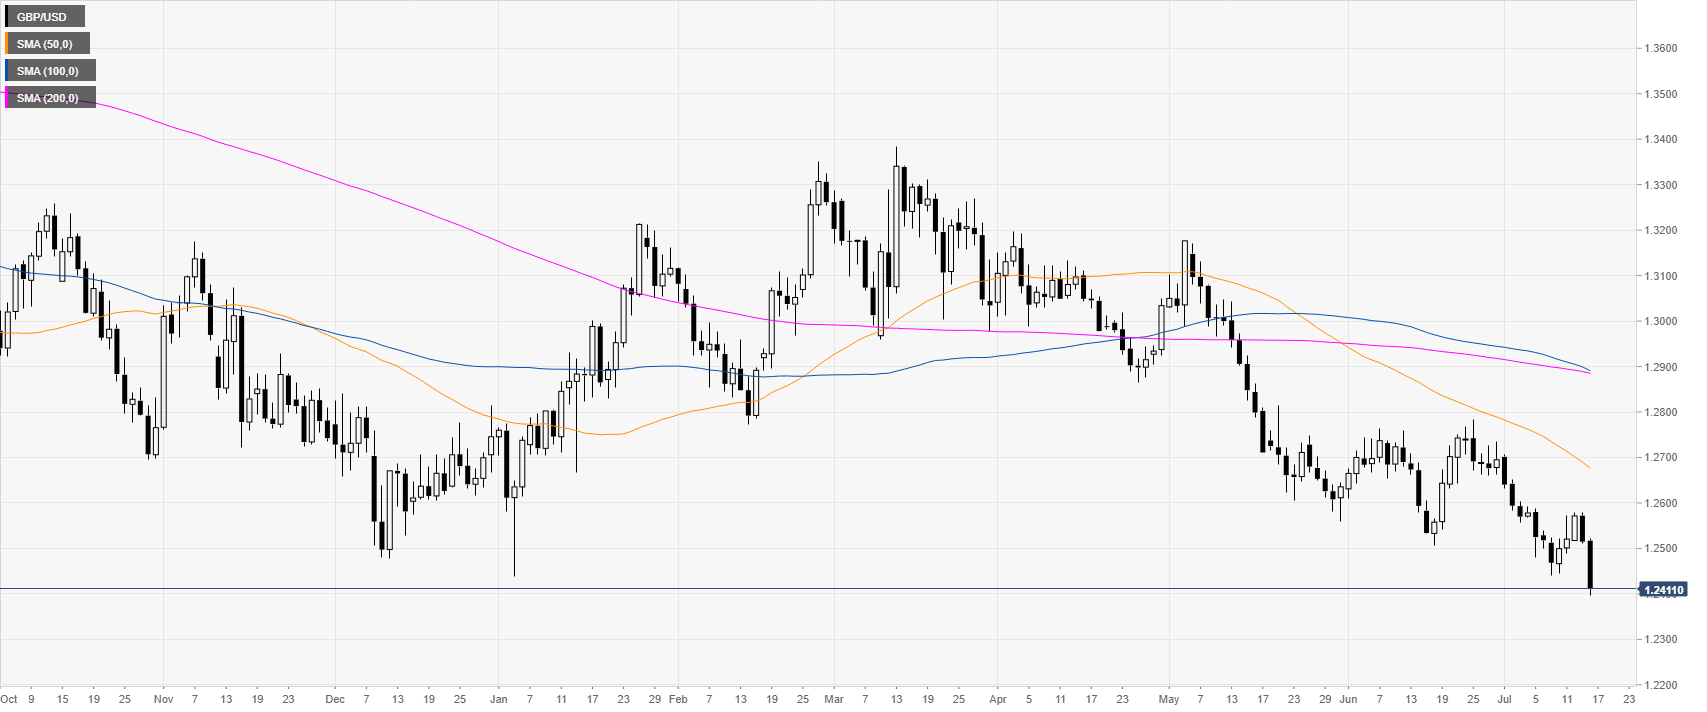
GBP/USD daily chart
GBP/USD is challenging 1.2400 figure as it is trading in a bear trend below its main daily simple moving averages (DSMAs). The market is under bearish pressure at 27-month lows. Investors will pay attention to the Fed's Chair Powell speech at 17.00 GMT.
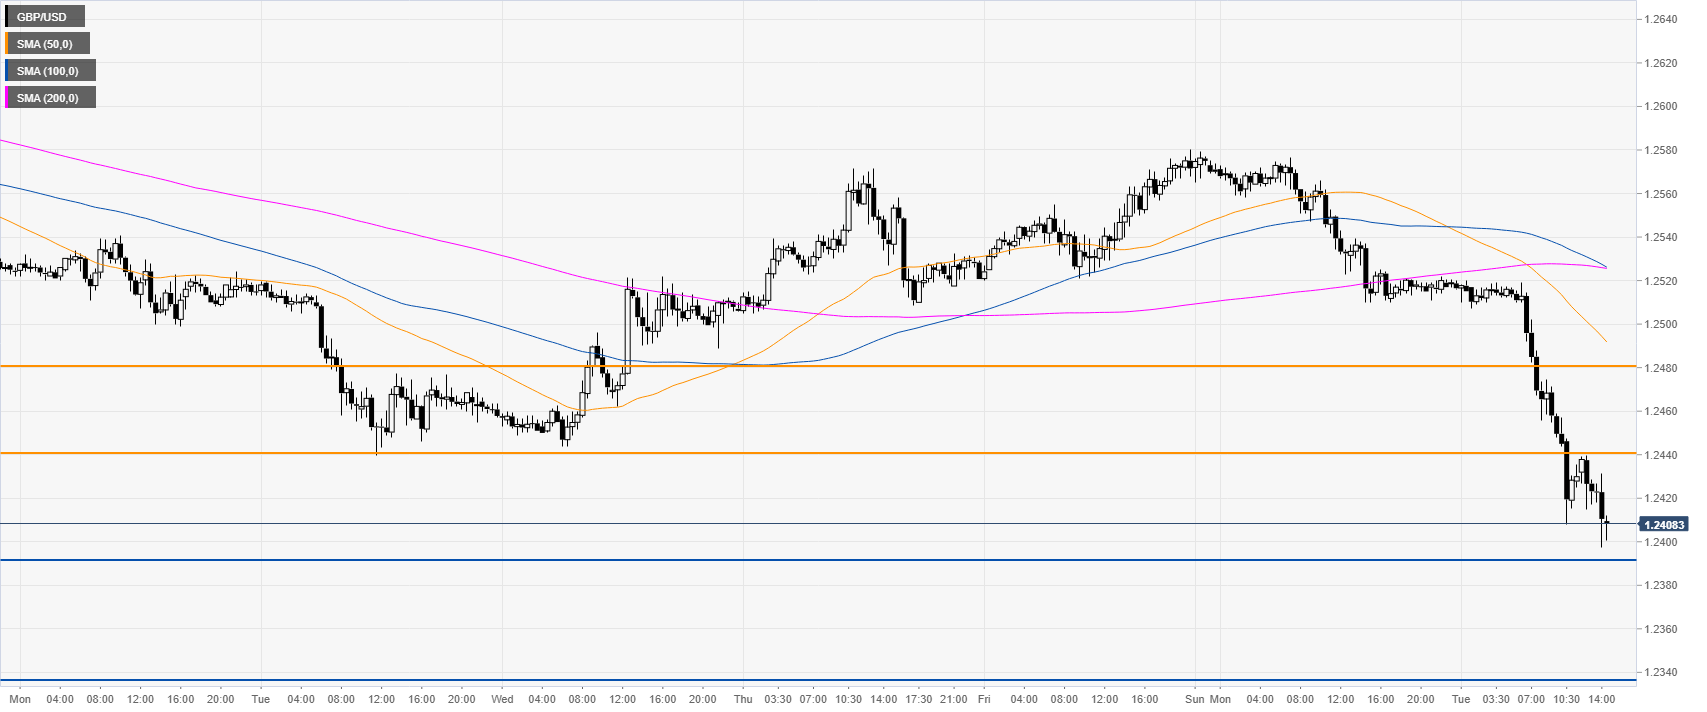
GBP/USD 4-hour chart
As bears broke below 1.2485 support, the next targets can be located near the 1.2390 and 1.2340 levels, according to the Technical Confluences Indicator.

GBP/USD 30-minute chart
The market is under strong selling pressure as bears are challenging the 1.2400 level. Immediate resistances can be seen at 1.2440 and 1.2480, according to the Technical Confluences Indicator.
Additional key levels
Author

Flavio Tosti
Independent Analyst
More from Flavio Tosti


