|
GBP/USD technical analysis: Cable sidelined near 1.2340 price level
- The Sterling rebounded from 2-weeks lows.
- The market is trapped in a tight range near the 1.2340 level.

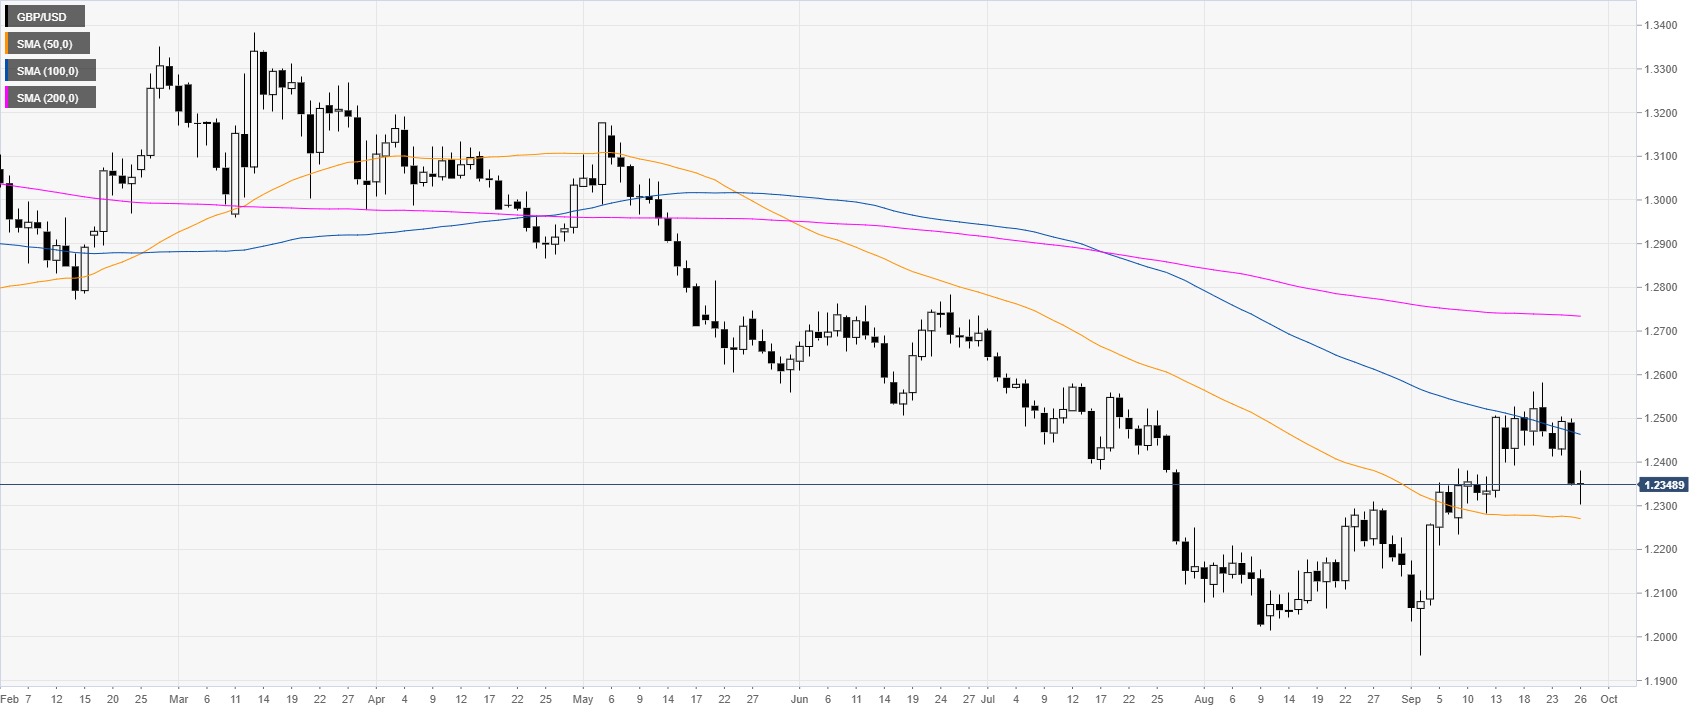
GBP/USD daily chart
The Sterling is trading in a downtrend below its 100 and 200-day simple moving averages (DSMAs). GBP/USD is virtually unchanged as the market enters the second part of the New York session.
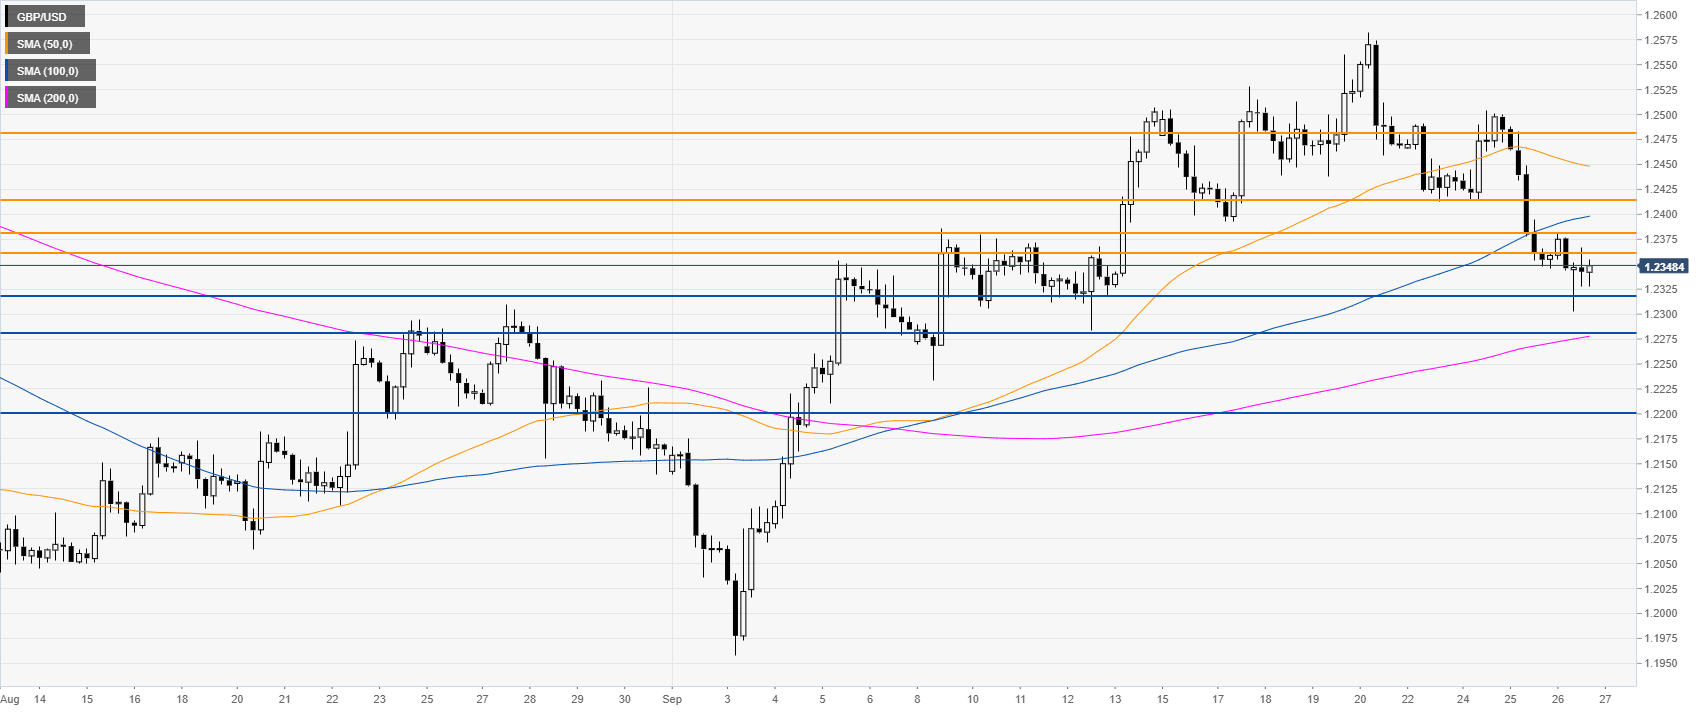
GBP/USD four-hour chart
GBP/USD is consolidating above the 1.2320 support while contained below the 1.2360 resistance and the 50 SMA. A break below 1.2320/1.2280 support zone can open the gates to the 1.2200 figure according to the Technical Confluences Indicator.
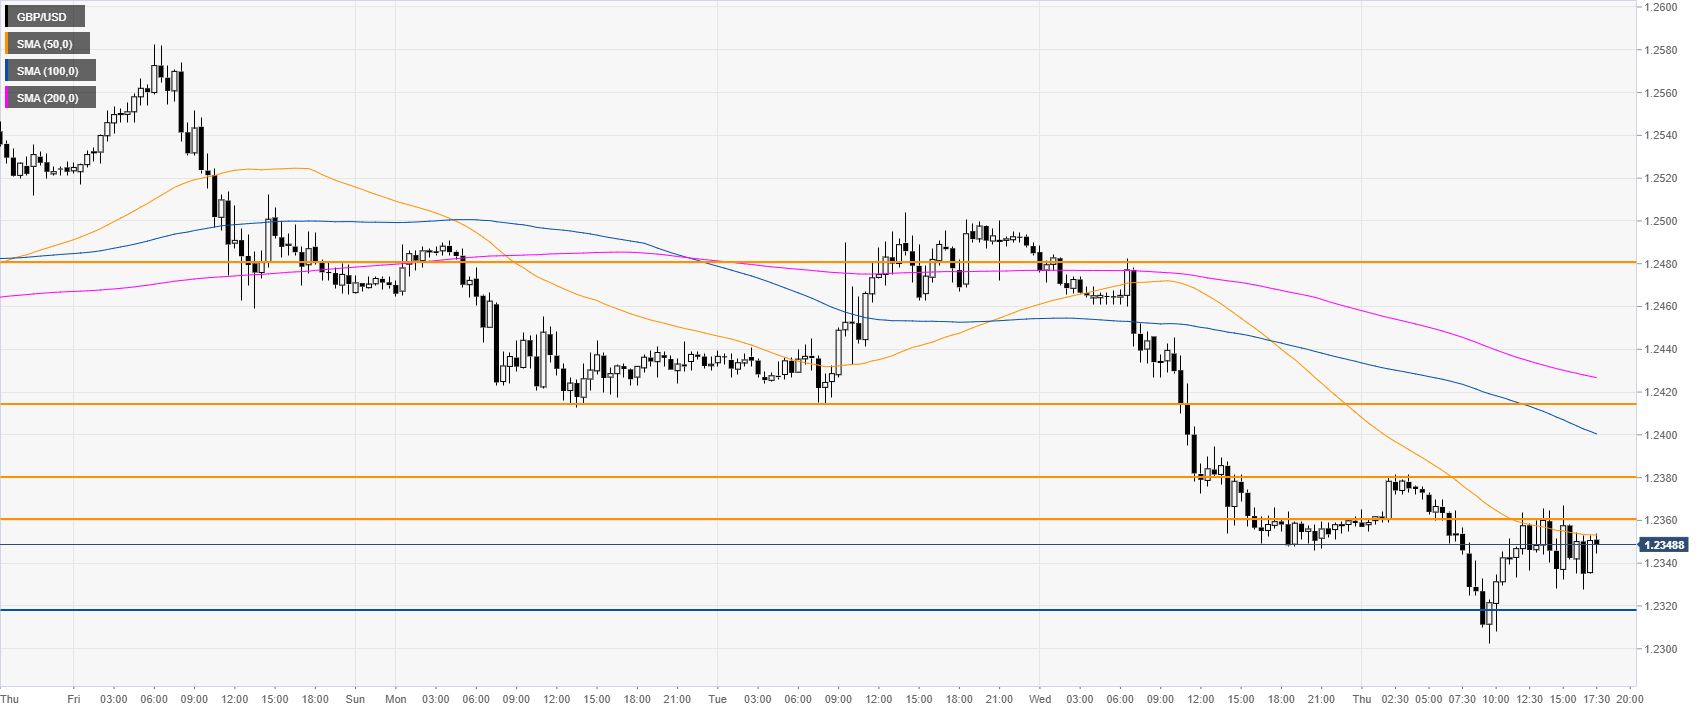
GBP/USD 30-minute
The Pound/US Dollar exchange rate is seesawing below the 1.2360 level and the 50 SMA on the 30-minute chart. In the absence of a breakdown below 1.2320, the market could probe the 1.2360/80 resistance zone. If broken the next level is seen at 1.2415 on the way up.
Additional key levels
Author

Flavio Tosti
Independent Analyst
More from Flavio Tosti


