GBP/USD Technical Analysis: Cable holding above 1.2730 level post-NFP

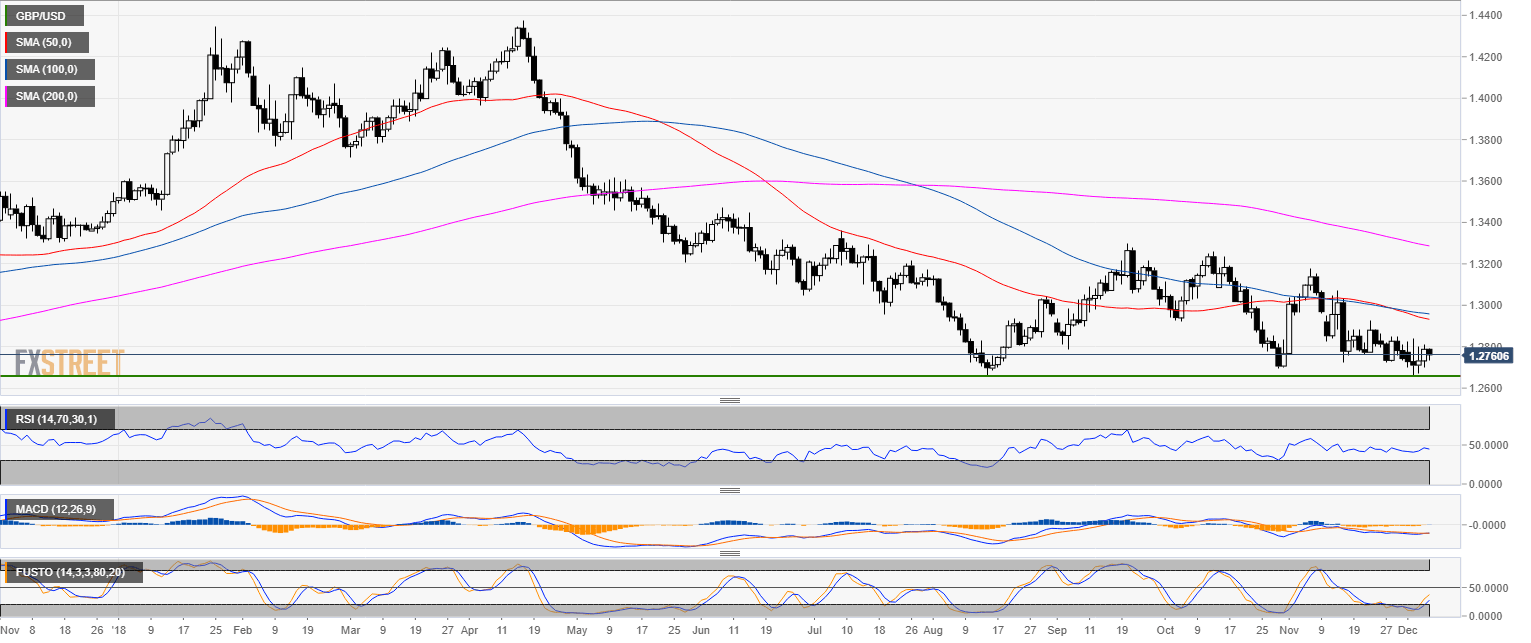
GBP/USD daily chart
- GBP/USD is trading in a bear trend below the 50, 100 and 200-day simple moving average (SMA).
- GBP/USD is trading near 4-month’s lows.
- The Nonfarm Payrolls for November came in at 155K vs. 200K weakening the USD.
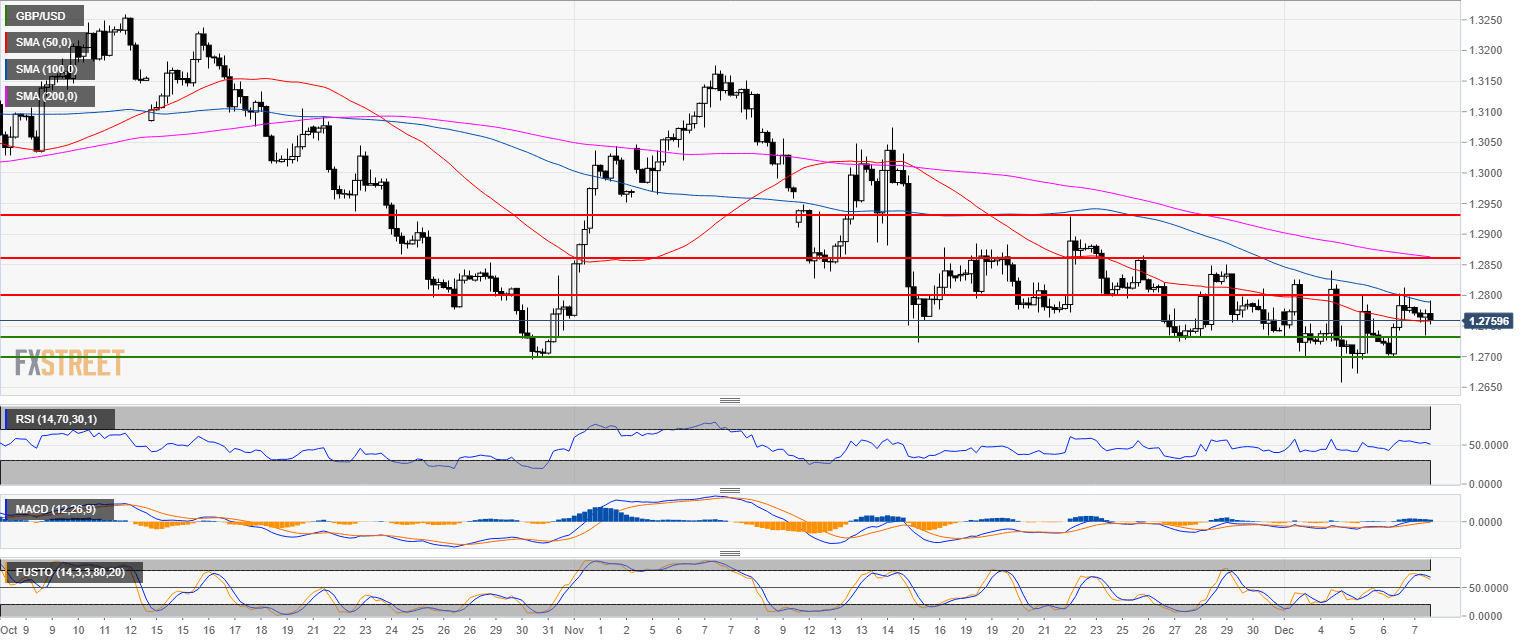
GBP/USD 4-hour chart
- GBP/USD is testing the 50 SMA and is trapped between 1.2750 and 1.2800 figure.
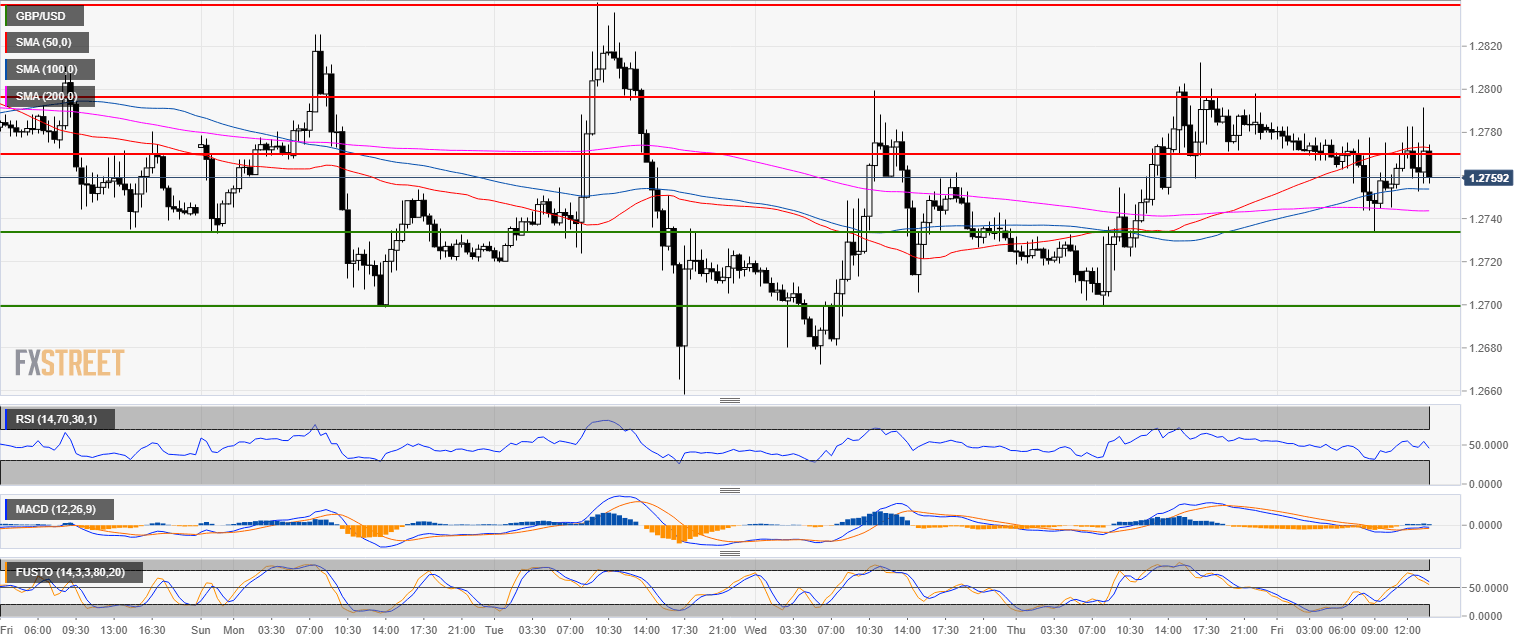
GBP/USD 30-minute chart
- The bias is bullish short-term as long as 1.2730 support holds.
Additional key levels
GBP/USD
Overview:
Today Last Price: 1.2758
Today Daily change: -30 pips
Today Daily change %: -0.235%
Today Daily Open: 1.2788
Trends:
Previous Daily SMA20: 1.2818
Previous Daily SMA50: 1.2938
Previous Daily SMA100: 1.2962
Previous Daily SMA200: 1.3293
Levels:
Previous Daily High: 1.2812
Previous Daily Low: 1.2699
Previous Weekly High: 1.2864
Previous Weekly Low: 1.2725
Previous Monthly High: 1.3176
Previous Monthly Low: 1.2723
Previous Daily Fibonacci 38.2%: 1.2769
Previous Daily Fibonacci 61.8%: 1.2742
Previous Daily Pivot Point S1: 1.272
Previous Daily Pivot Point S2: 1.2653
Previous Daily Pivot Point S3: 1.2607
Previous Daily Pivot Point R1: 1.2833
Previous Daily Pivot Point R2: 1.2879
Previous Daily Pivot Point R3: 1.2947
Author

Flavio Tosti
Independent Analyst


