|

GBP/USD technical analysis: Cable hits a new 2019 low at 1.2376 as the week comes to an end

  • GBP/USD hit a new 2019 low following the release of the better-than-expected US GDP data.
  • The levels to beat for bears are seen at 1.2388 and 1.2340, according to the Technical Confluences Indicator.
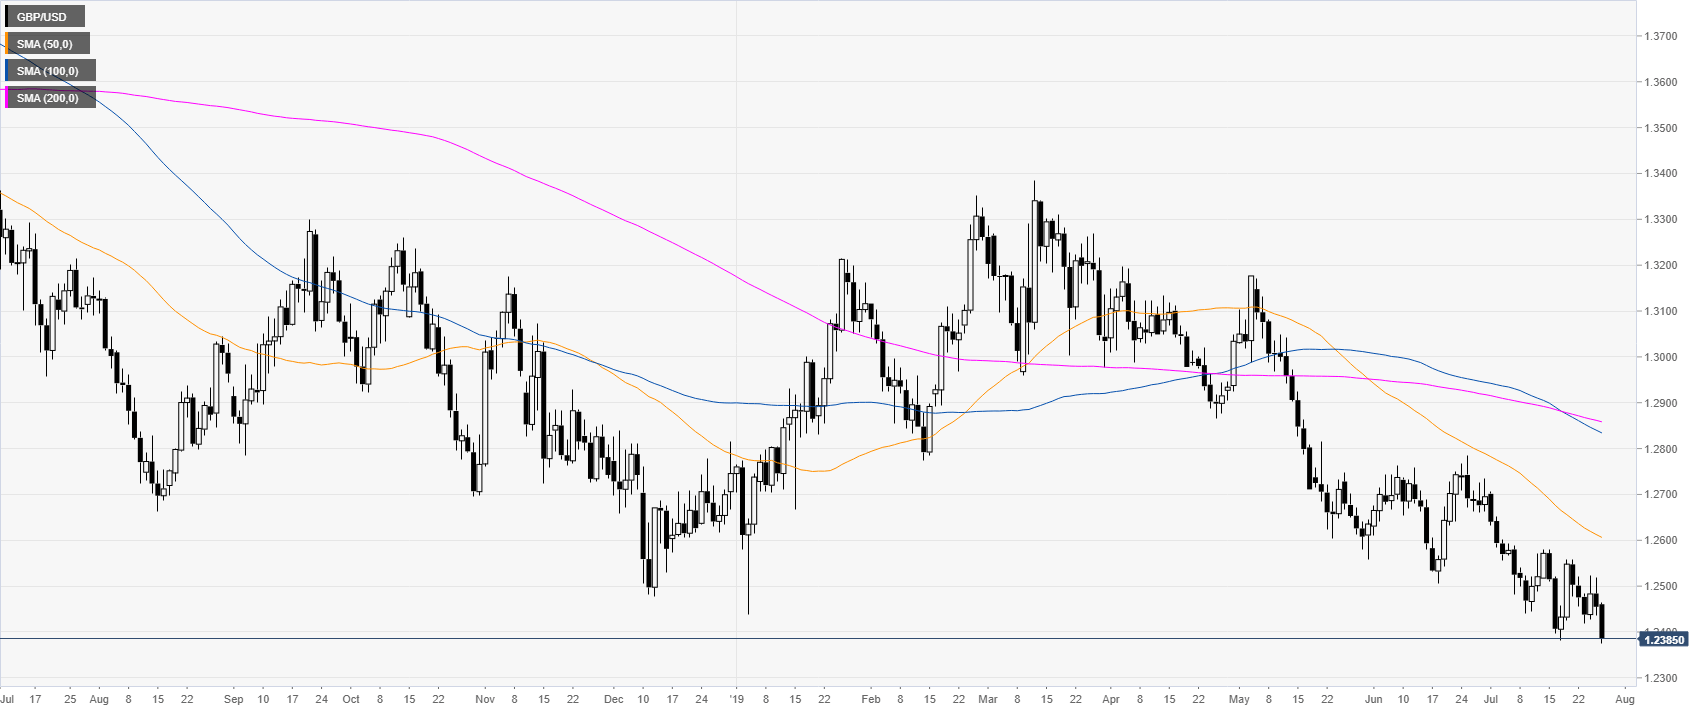
GBP/USD daily chart

Cable hit a new 2019 low while trading below the main daily simple moving averages (DSMAs). Earlier in the New York session, the US Gross Domestic Product (GDP) Annualized Q2 came in above expectations at 2.1% vs. 1.8% forecasts.

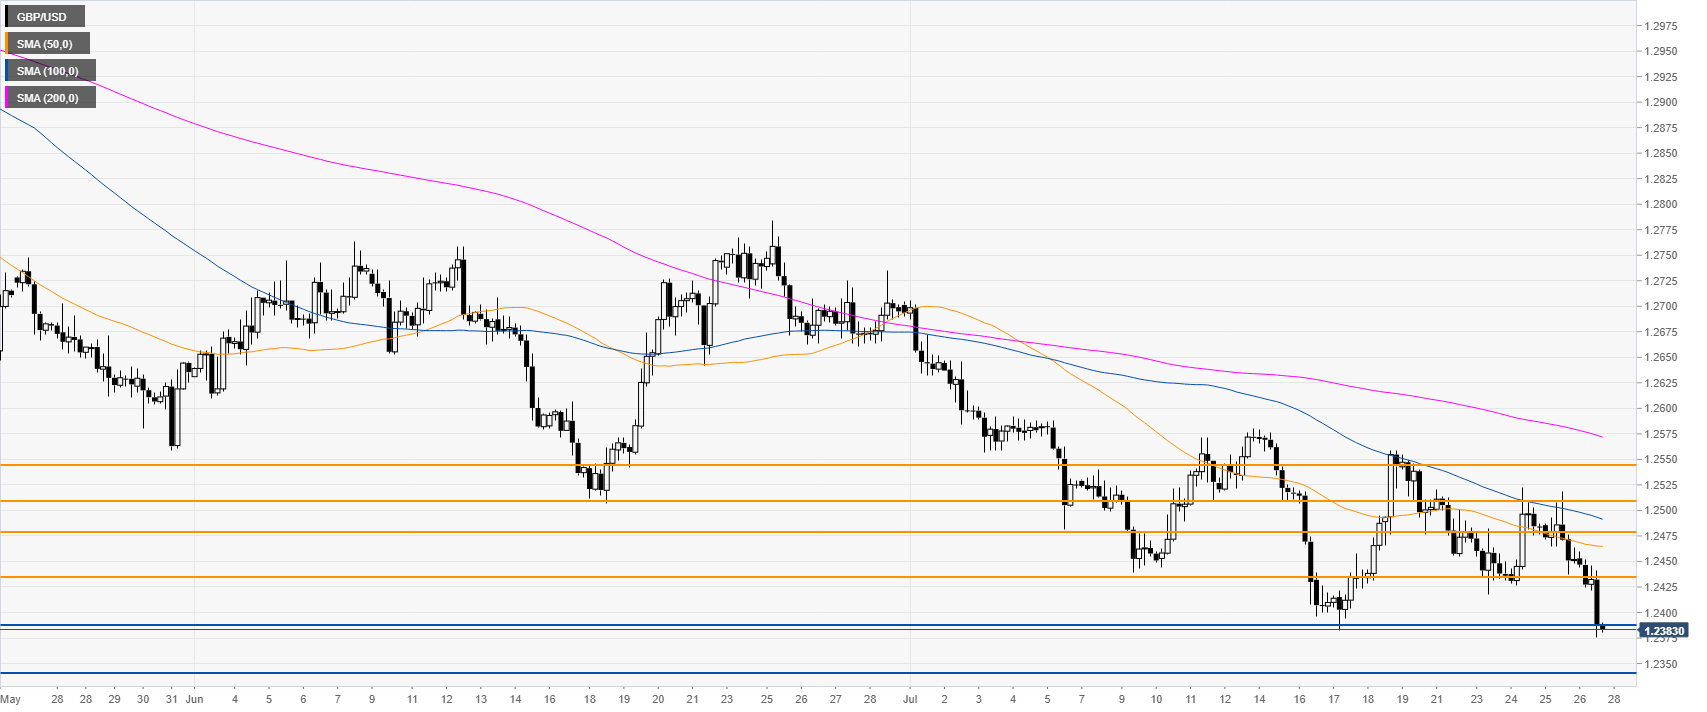
GBP/USD 4-hour chart

GBP/USD is challenging the 1.2388 support near the 2019 low. Bears want to reach 1.2340 and 1.2300 on the way down. Resistances are seen near 1.2435 and 1.2480, according to the Technical Confluences Indicator.

Additional key levels

GBP/USD

Overview
Today last price1.2386
Today Daily Change-0.0069
Today Daily Change %-0.55
Today daily open1.2455
 
Trends
Daily SMA201.2522
Daily SMA501.2613
Daily SMA1001.284
Daily SMA2001.2862
Levels
Previous Daily High1.2518
Previous Daily Low1.2437
Previous Weekly High1.2579
Previous Weekly Low1.2382
Previous Monthly High1.2784
Previous Monthly Low1.2506
Daily Fibonacci 38.2%1.2468
Daily Fibonacci 61.8%1.2487
Daily Pivot Point S11.2422
Daily Pivot Point S21.2389
Daily Pivot Point S31.234
Daily Pivot Point R11.2503
Daily Pivot Point R21.2552
Daily Pivot Point R31.2585

Author

Flavio Tosti

Flavio Tosti

Independent Analyst


More from Flavio Tosti
Share:

Editor's Picks

EUR/USD hovers around nine-day EMA above 1.1800

EUR/USD gains ground for the second successive session, trading around 1.1820 during the Asian hours on Monday. The 14-day Relative Strength Index momentum indicator stands at 51 (neutral) after recovering above the midline, indicating stabilizing momentum. 

GBP/USD gathers strength above 1.3500 amid tariff confusion

The GBP/USD pair gains traction to around 1.3520 during the early Asian session on Monday. The US Dollar faces some selling pressure against the Cable as tariff uncertainty lingers. Traders will take more cues from the US Producer Price Index report for January, which will be published later on Friday. 

Gold climbs to fresh monthly high on trade war fears, geopolitical risks, weaker USD

Gold registered its highest-ever weekly close, above the $5,100 mark on Friday, and gains strong follow-through traction at the start of a new week. This also marks the fourth straight day of a positive move and lifts the commodity beyond the $5,150 level, or a fresh monthly peak, during the Asian session. 

Cardano braces for impact as US tariff storm brews

Cardano is down 4% at press time on Monday, entering its third consecutive day of decline. Bearish bias in Cardano’s derivatives market positional buildup aligns with rising pressure on the broader cryptocurrencymarket amid US President Donald Trump's reassessment of global tariffs and domestic conflict with the US Supreme Court. 

Liberation day take two, the tariff machine just changed gears

Let me caveat this from the outset. What we are watching is first-order mechanics, not the grand macro endgame. This is the market’s immediate reflex to a 15% Trump tariff levy dressed up as judicial drama. The Supreme Court blocked Trump tarrif hammer. The White House came back with a scalpel.

Top Crypto Losers: Zcash, Pump.fun, and LayerZero extended losses as Bitcoin loses $65,000

The cryptocurrency market starts the week in panic mode, with altcoins Zcash, Pump.fun, and LayerZero. Bitcoin falls below $65,000 as the US President Donald Trump regroups amid renewed trade policy risks.