GBP/USD Technical Analysis: Cable bears show no mercy as the market reverse daily gains - 1.2700 figure in sight

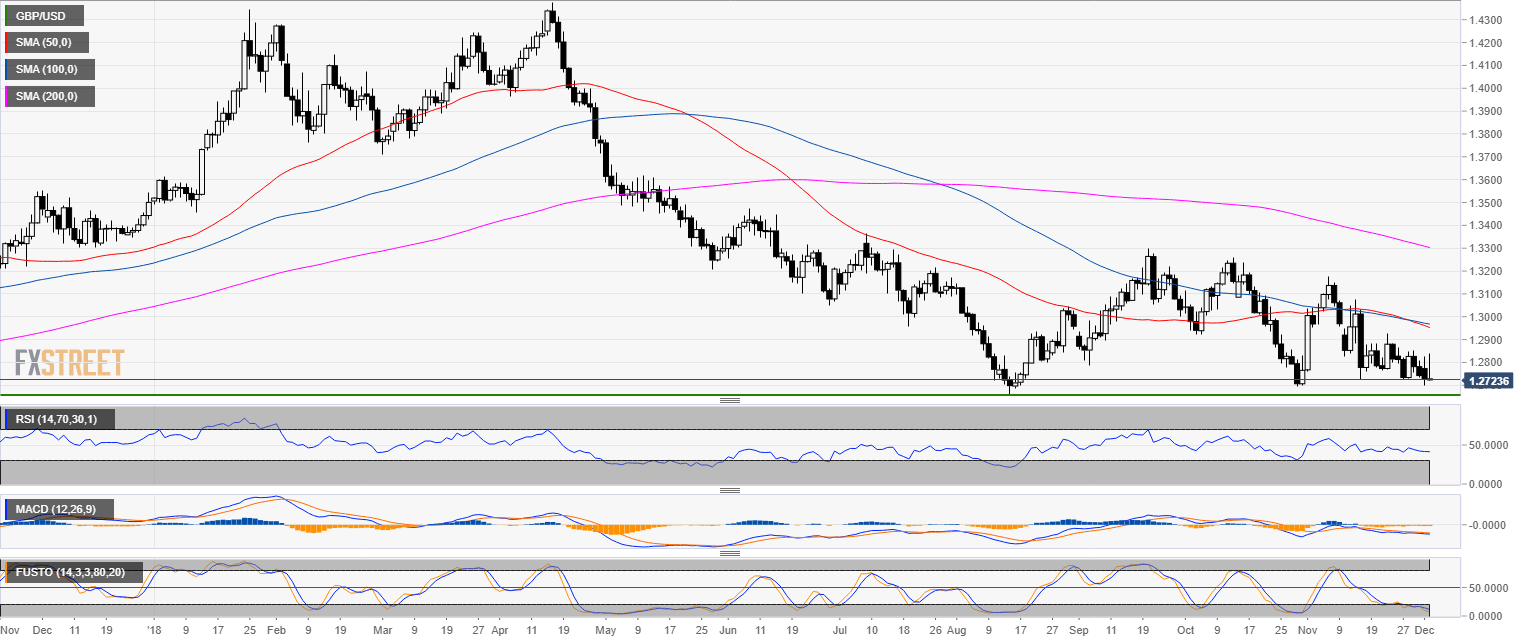
GBP/USD daily chart
- GBP/USD is trading in a bear trend below the 200-day simple moving average (SMA).
- GBP/USD reached the 1.2800 target as forecast.
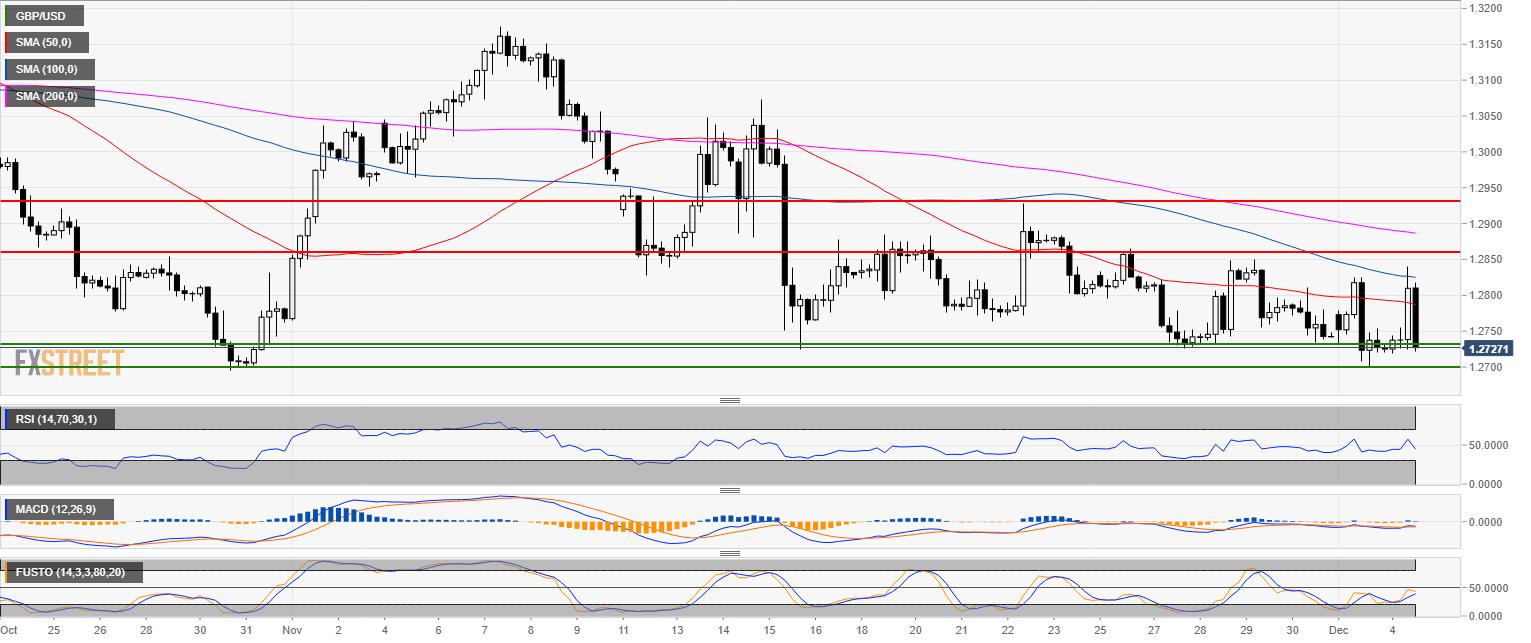
GBP/USD 4-hour chart
- Cable bears were quick to erase the gains made to 1.2800 figure as the market rejected the 100 SMA.
- GBP/USD is back to the November lows.
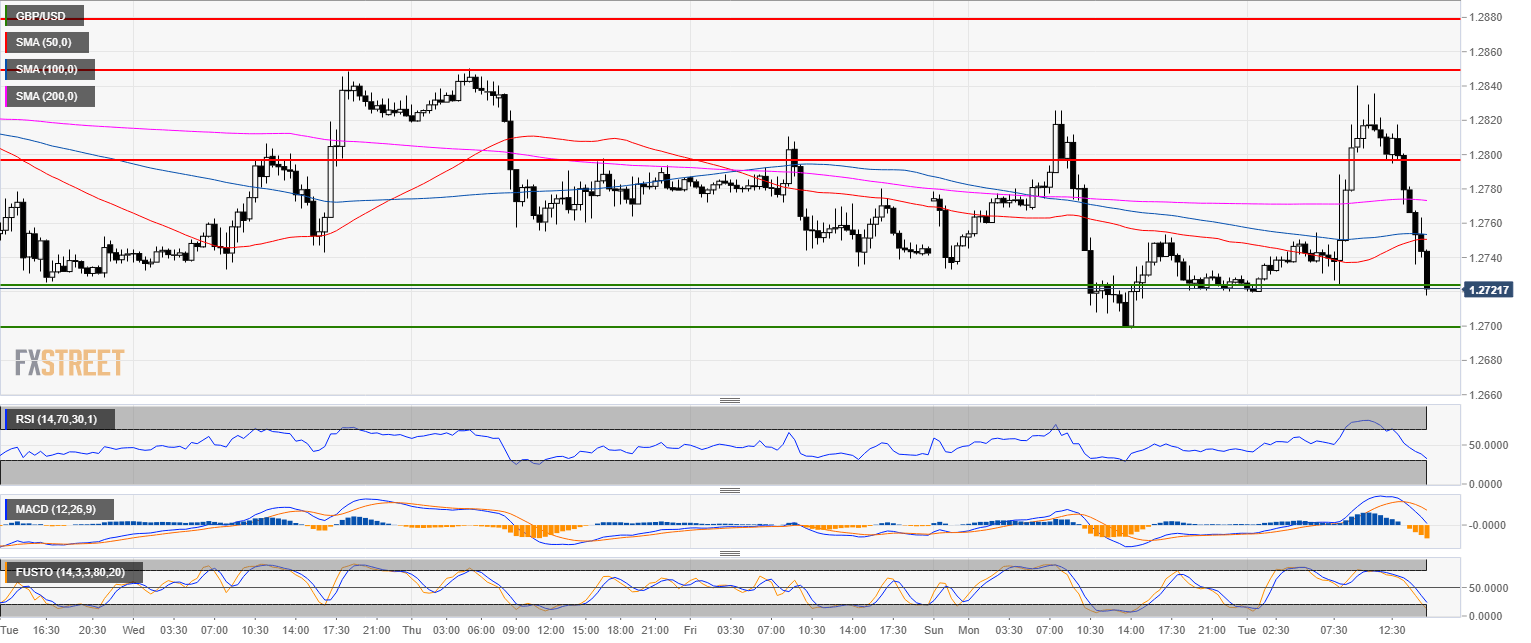
GBP/USD 30-minute chart
- GBP/USD bears reversed the daily gains to 1.2800.
- The momentum is back to negative and a push down to 1.2700 is likely the next objective for sellers.
Additional key levels
GBP/USD
Overview:
Today Last Price: 1.2732
Today Daily change: 4.0 pips
Today Daily change %: 0.0314%
Today Daily Open: 1.2728
Trends:
Previous Daily SMA20: 1.2871
Previous Daily SMA50: 1.2962
Previous Daily SMA100: 1.2972
Previous Daily SMA200: 1.3311
Levels:
Previous Daily High: 1.2826
Previous Daily Low: 1.2699
Previous Weekly High: 1.2864
Previous Weekly Low: 1.2725
Previous Monthly High: 1.3176
Previous Monthly Low: 1.2723
Previous Daily Fibonacci 38.2%: 1.2747
Previous Daily Fibonacci 61.8%: 1.2777
Previous Daily Pivot Point S1: 1.2676
Previous Daily Pivot Point S2: 1.2624
Previous Daily Pivot Point S3: 1.2549
Previous Daily Pivot Point R1: 1.2803
Previous Daily Pivot Point R2: 1.2878
Previous Daily Pivot Point R3: 1.293
Author

Flavio Tosti
Independent Analyst


