GBP/USD soars above 1.2500 as a bullish-engulfing pattern emerges
- Disappointing New York Empire State Manufacturing Index plummets to -31.3, causing concern for the US economy.
- US debt ceiling negotiations progress with “serious and constructive” talks according to Biden and Brainard.
- BoE’s recent 25 bps rate hike aims to curb inflation; upcoming labor market data could hint at another hike in June.


GBP/USD bounces off last week’s low of 1.2443 and rises above the 1.2500 figure as a bullish-engulfing technical pattern emerges. Factors like a soft US Dollar (USD) and appetite for riskier assets seem to be behind GBP/USD’s recovery. At the time of writing, the GBP/USD is trading at 1.2515.
Soft USD and risk appetite fuel Sterling's recovery
The US economic agenda reported the New York Empire State Manufacturing Index, which disappointed investors, plunged -31.3 vs. the -3.9 estimated. The report revealed that nearly 50% of respondents to the survey said business conditions worsened. The data revealed the orders index slid, while a gauge of prices showed an increase, and the employment component shrank.
Although the report was negative for the US economy, a deceleration of hiring suggests the labor market is easing. But, a price jump would warrant further action by the US Federal Reserve (Fed), meaning higher rates. The GBP/USD stopped its rally on the release, probably based on the data and also on technical resistance surrounding the day’s high.
Aside from the data, the US debt ceiling continues to grab the headlines. US President Joe Biden commented that talks were “moving along,” while Lael Brainard, the National Economic Director, commented that negotiations were serious and constructive.
In the central bank front, two Fed speakers pushed back against cutting rates in 2024 while emphasizing that inflation is high and that the fast-hiking campaign is still working its way through the economy. In the meantime, on the hawkish spectrum, Minnesota’s Fed President Neil Kashkari emphasized that inflation is much too high, though he commented that it’s slowing down. He added that the US central bank should not be fooled by a few months of data, adding that the Fed has more work to do.
On the UK front, in the last week, the Bank of England raised rates by 25 bps, the 12th hike since the BoE’s commenced its tightening cycle, trying to curb inflation. Given the backdrop, Tuesday’s labor market data to be revealed would shed some light regarding wage pressures, which, if they come above estimates, could pave the way for another rate hike at the upcoming June meeting.
GBP/USD Price Analysis: Technical outlook
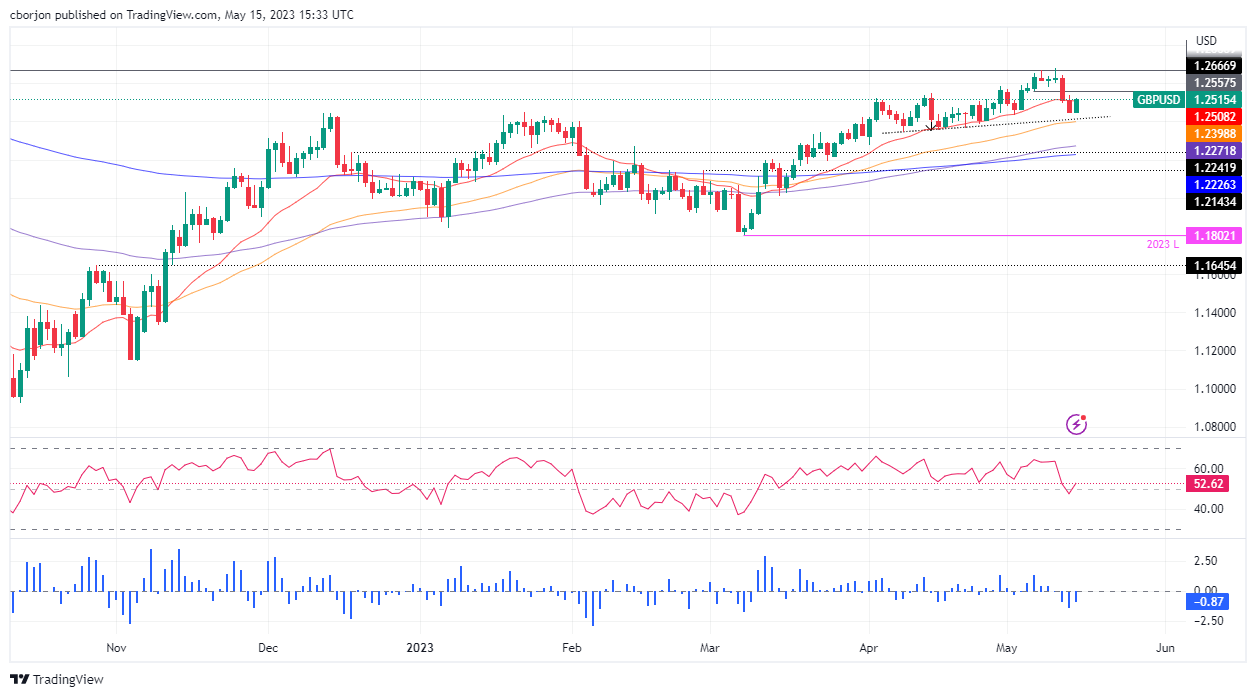
From a technical perspective, the GBP/USD is forming a bullish engulfing candle chart pattern but facing solid resistance at the 20-day Exponential Moving Average (EMA) at 1.2507. If GBP/USD struggles to crack the latter, the aforementioned two-candle pattern could be at risk of being invalidated, thus opening the door for losses below the psychological 1.2500 mark. If that scenario plays out, the GBP/USD next support would be May 15 at 1.2443, followed by the 50-day EMA at 1.2398.
Otherwise, if GBP/USD achieves a daily close above the 20-day EMA, the bullish engulfing candle pattern warrants further upside ahead of Tuesday’s jobs report in the United Kingdom. Key resistance levels are to be found at 1.2541, followed by May’s 5 support turned resistance at 1.2557, ahead of 1.2600.
Author
Christian Borjon Valencia
FXStreet
Markets analyst, news editor, and trading instructor with over 14 years of experience across FX, commodities, US equity indices, and global macro markets.