GBP/USD rebounds toward 1.3400 as markets look past strong US data
- GBP/USD recovers to 1.3361 after touching a session high of 1.3403.
- ISM Services PMI jumps to 56.1 while ADP jobs rise to 63K.
- BoE March cut odds plunge from 74% to 25% amid Oil-driven inflation fears.

The Pound Sterling (GBP) recovers some ground versus the US Dollar (USD) on Wednesday, though tensions in the Middle East remain high, pushing macroeconomic data releases into the backseat. A better-than-expected employment reading in the US was mainly ignored by traders with their sights set on Friday’s Nonfarm Payrolls report. At the time of writing, GBP/USD trades at 1.3361.
Sterling steadies despite Middle East tensions, with traders focused on Friday’s jobs report
During the European session, GBP/USD edged towards its daily high of 1.3403 amid relief at a possible de-escalation of the conflict between the US and Iran. Nevertheless, Reuters reported that the “US sub sinks Iranian warship,” triggered a leg-down in the pair.
In the meantime, US economic data witnessed the release of the ISM Services PMI for February, which showed that business activity is gathering pace, up from 53.8 a month ago, to 56.1, exceeding estimates for a deceleration to 53.5.
Additionally, the ADP Employment Change report in February showed that private companies hired more people than expected, with the print coming at 63K, well above January’s 11K and beating forecasts of 50K.
In the UK, the Chancellor of the Exchequer Rachel Reeves said that the “government had the right economic plan” for the country. She acknowledged inflationary pressures due to the Middle East conflict, added that the government is on course to “secure our economy against shocks and protect families from the turbulence that we see beyond our borders.”
The aftermath of the Middle East conflict has money markets showing traders trimmed the odds for a rate cut by the Bank of England. The jump in oil prices pushed rate cut odds from 74% to just 25% as of writing, according to Prime Market Terminal data.
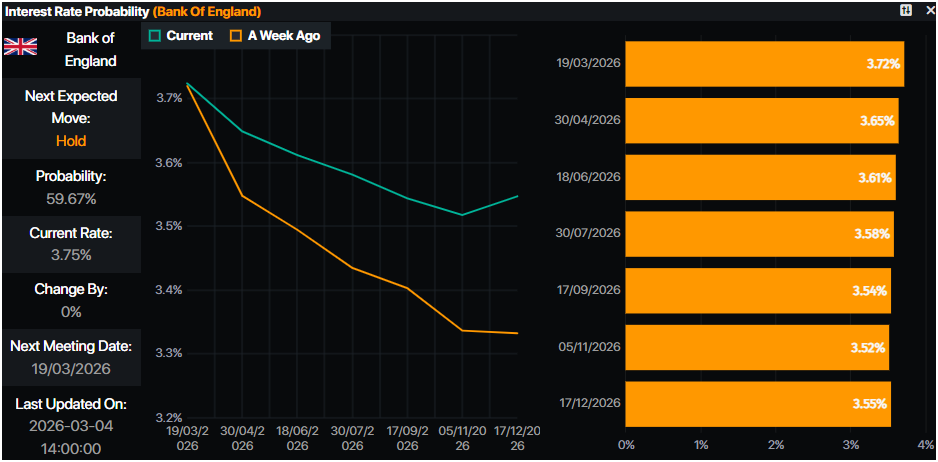
Ahead of this week, the UK economic docket is absent. In the US, traders will lean on speeches by Fed officials, and the release of employment data, namely the Challenger Job Cuts, Initial Jobless Claims and Nonfarm Payroll figures for February.
GBP/USD Price Forecast: Technical outlook
In the daily chart, GBP/USD trades at 1.3380. The near-term bias is mildly bearish as price slips below the clustered simple moving averages around 1.3535, confirming a loss of upside momentum seen after repeated failures along the descending resistance trend line from 1.3869. The recent break under the 1.3498 trend-line resistance-turned-cap underscores sellers’ control, while the longer-term rising support line from 1.3035 still holds below price and tempers the downside outlook into a corrective tone rather than a fully developed downtrend.
Initial resistance emerges at 1.3498, where the broken descending trend line and the nearby moving average group converge, followed by the late-January high near 1.3554. A daily close above this zone would be needed to negate the current bearish bias and reopen the path toward the 1.3650–1.3700 band. On the downside, immediate support lies at the psychological 1.3350 region, ahead of the rising trend-line support projecting from 1.3035, with a decisive break there exposing the next lower area toward 1.3250.
(The technical analysis of this story was written with the help of an AI tool.)
(This story was corrected on March 4 at 16:27 to say that the ADP Employment Change print in January was 11K, not 22K.)
Pound Sterling Price This week
The table below shows the percentage change of British Pound (GBP) against listed major currencies this week. British Pound was the strongest against the Swiss Franc.
| USD | EUR | GBP | JPY | CAD | AUD | NZD | CHF | |
|---|---|---|---|---|---|---|---|---|
| USD | 1.13% | 0.37% | 0.79% | 0.15% | -0.20% | 0.44% | 1.66% | |
| EUR | -1.13% | -0.77% | -0.37% | -0.98% | -1.32% | -0.68% | 0.52% | |
| GBP | -0.37% | 0.77% | 0.23% | -0.22% | -0.56% | 0.08% | 1.29% | |
| JPY | -0.79% | 0.37% | -0.23% | -0.58% | -0.92% | -0.23% | 0.91% | |
| CAD | -0.15% | 0.98% | 0.22% | 0.58% | -0.38% | 0.36% | 1.52% | |
| AUD | 0.20% | 1.32% | 0.56% | 0.92% | 0.38% | 0.64% | 1.86% | |
| NZD | -0.44% | 0.68% | -0.08% | 0.23% | -0.36% | -0.64% | 1.22% | |
| CHF | -1.66% | -0.52% | -1.29% | -0.91% | -1.52% | -1.86% | -1.22% |
The heat map shows percentage changes of major currencies against each other. The base currency is picked from the left column, while the quote currency is picked from the top row. For example, if you pick the British Pound from the left column and move along the horizontal line to the US Dollar, the percentage change displayed in the box will represent GBP (base)/USD (quote).
Author

Christian Borjon Valencia
FXStreet
Markets analyst, news editor, and trading instructor with over 14 years of experience across FX, commodities, US equity indices, and global macro markets.














