GBP/USD Price Forecast: Slides below mid-1.3400s, over one-week low ahead of UK CPI
- GBP/USD attracts sellers for the third straight day as the USD prolongs its uptrend.
- The mixed technical setup warrants caution before placing aggressive bearish bets.
- Traders now look to the UK CPI report for some impetus ahead of FOMC minutes.

The GBP/USD pair drifts lower for the third consecutive day on Wednesday – also marking the fourth day of a negative move in the previous five – and drops to an over one-week low during the Asian session. Spot prices currently trade around the 1.3475 region, down 0.10% for the day amid some follow-through US Dollar (USD) buying and ahead of the UK consumer inflation figures.
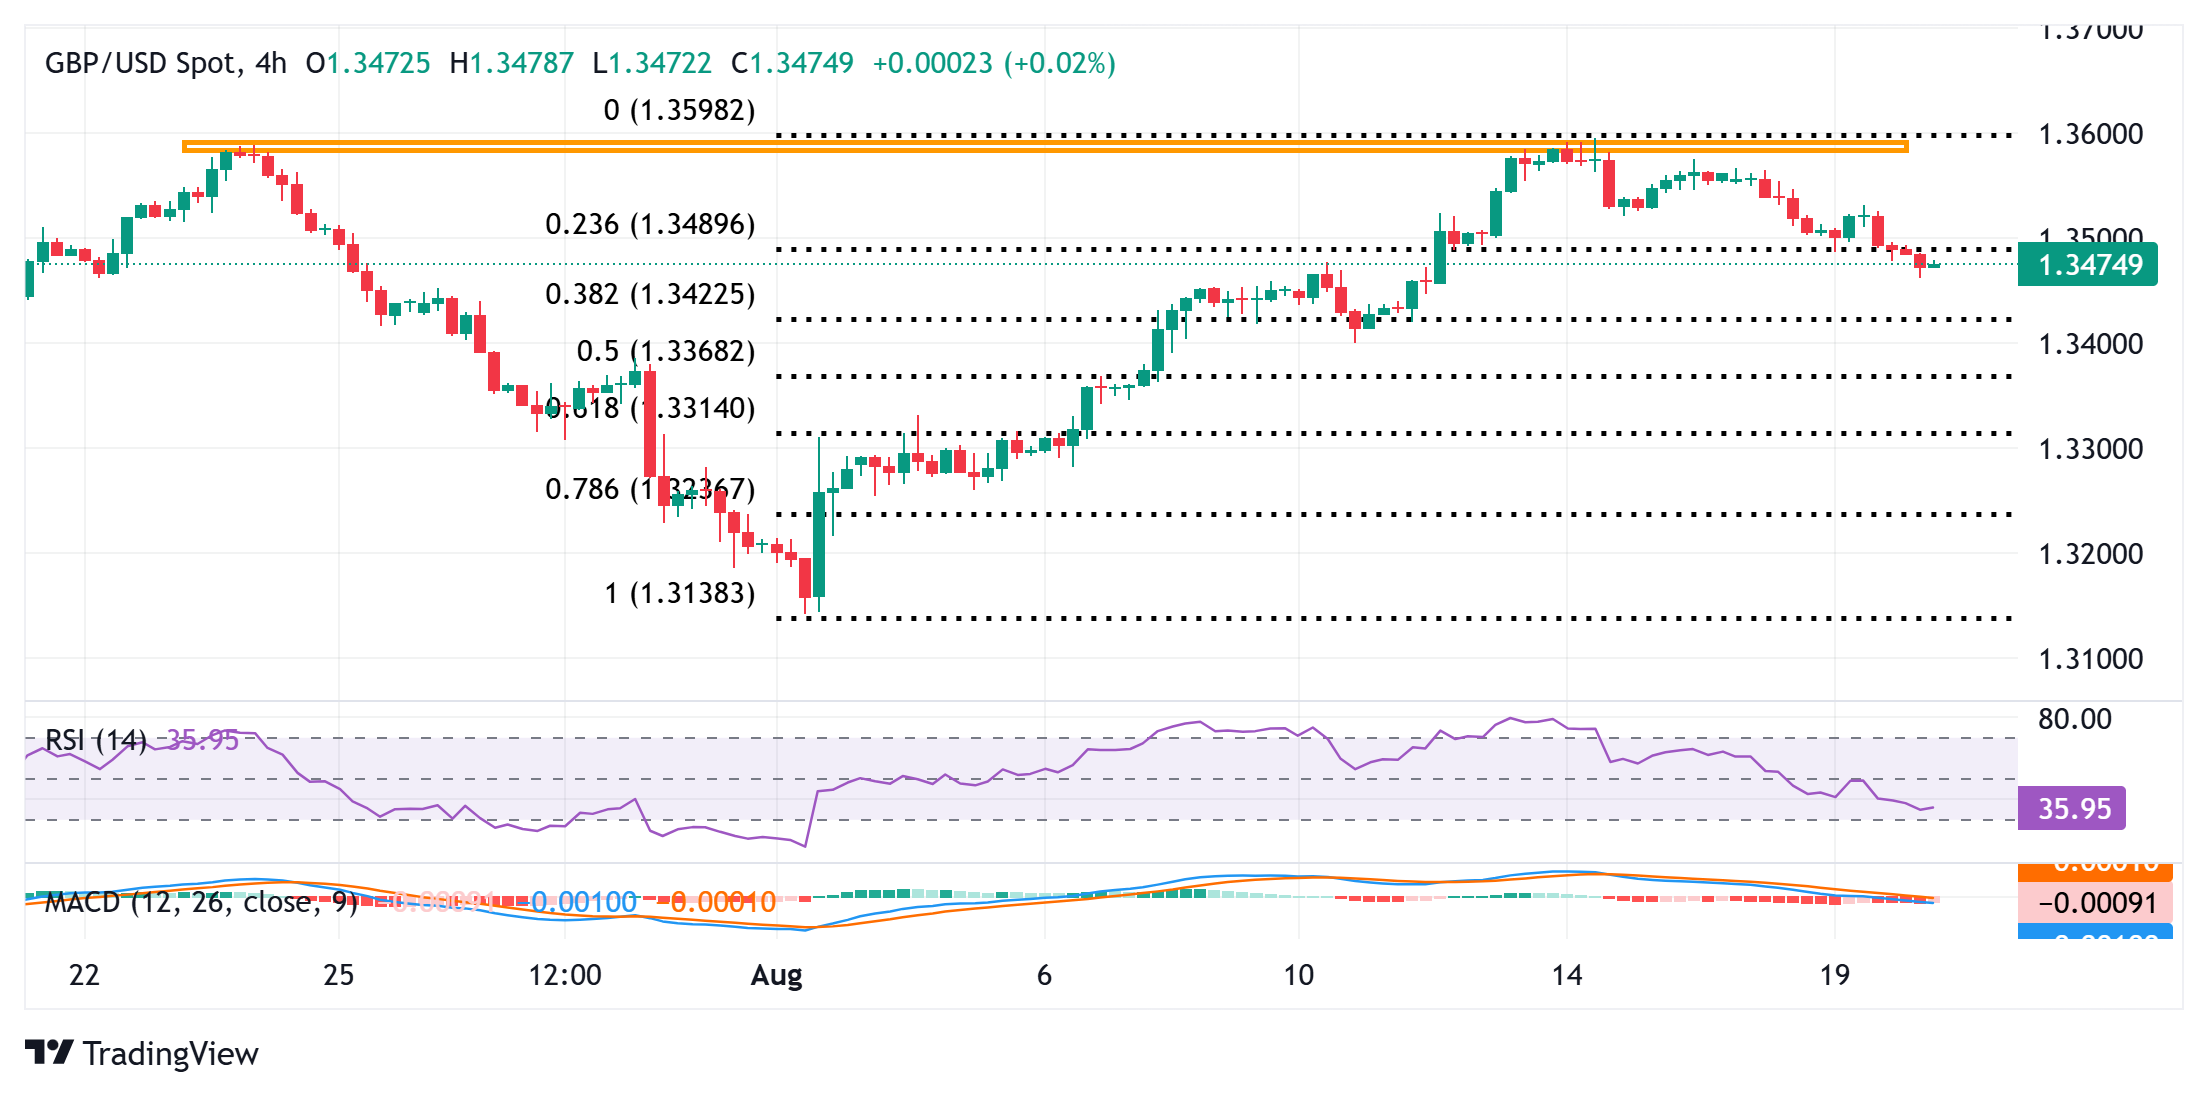
From a technical perspective, last week's failure ahead of the 1.3600 mark constituted the formation of a bearish double-top chart pattern. A subsequent fall below the 23.6% Fibonacci retracement level of the recent rally from the 1.3140 area, or the lowest level since mid-April, touched earlier this month, backs the case for further losses. However, positive oscillators on the daily chart warrant some caution.
Hence, any further slide is likely to attract some buyers near the 1.3450 support zone, which should help limit the downside for the GBP/USD pair near the 1.3420-1.3415 region, or the 38.2% Fibo. retracement level. Some follow-through selling below the 1.3400 mark, however, will suggest that spot prices have topped out in the near-term and pave the way for some meaningful depreciating move.
On the flip side, attempted recovery back above the 23.6% Fibo. retracement level, and the 1.3500 psychological mark could face some resistance near the overnight swing high, around the 1.3530 region. A sustained strength beyond could lift the GBP/USD pair to the 1.3575-1.3580 hurdle, above which bulls could make a fresh attempt to conquer the 1.3600 mark. The latter should act as a key pivotal point, which, if cleared decisively, will negate any negative bias and set the stage for the resumption of the month-to-date (MTD) uptrend.
GBP/USD 4-hour chart
Economic Indicator
Consumer Price Index (YoY)
The United Kingdom (UK) Consumer Price Index (CPI), released by the Office for National Statistics on a monthly basis, is a measure of consumer price inflation – the rate at which the prices of goods and services bought by households rise or fall – produced to international standards. It is the inflation measure used in the government’s target. The YoY reading compares prices in the reference month to a year earlier. Generally, a high reading is seen as bullish for the Pound Sterling (GBP), while a low reading is seen as bearish.
Read more.Next release: Wed Aug 20, 2025 06:00
Frequency: Monthly
Consensus: 3.7%
Previous: 3.6%
Source: Office for National Statistics
The Bank of England is tasked with keeping inflation, as measured by the headline Consumer Price Index (CPI) at around 2%, giving the monthly release its importance. An increase in inflation implies a quicker and sooner increase of interest rates or the reduction of bond-buying by the BOE, which means squeezing the supply of pounds. Conversely, a drop in the pace of price rises indicates looser monetary policy. A higher-than-expected result tends to be GBP bullish.
Author

Haresh Menghani
FXStreet
Haresh Menghani is a detail-oriented professional with 10+ years of extensive experience in analysing the global financial markets.
















