GBP/USD Price Forecast: Rebounds on data, yet falls below 1.3100
- GBP/USD trades below 1.3100 after posting an upbeat retail sales report.
- A daily close above 1.3100 could target further upside, with resistance at 1.3175 and 1.3200, followed by 1.3266.
- A drop below 1.3100 may shift momentum to sellers, targeting 1.3058 and the September 11 low of 1.3001.

The Pound Sterling recovered some ground against the Greenback on Tuesday, following a better-than-expected retail sales report, yet it has fallen below the 1.3100 figure as the North American session progresses. The GBP/USD trades at 1.3090, virtually unchanged.
GBP/USD Price Forecast: Technical outlook
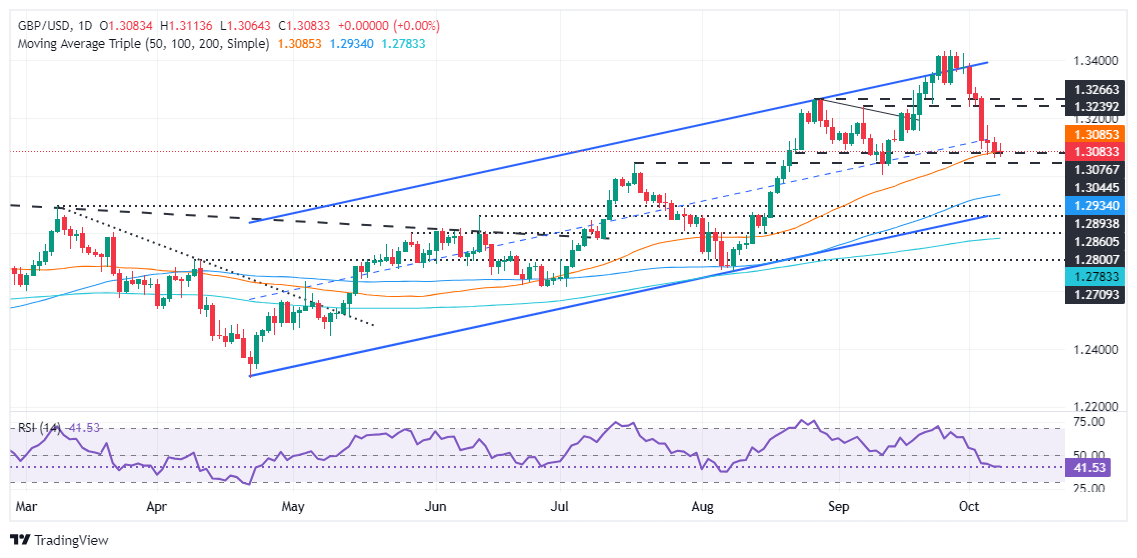
Price action shows some consolidation at around the 1.3050 – 1.3120 area for the second straight day. Even though momentum shifted bearish, according to the Relative Strength Index (RSI), the GBP/USD printed a leg-up on Tuesday and pierced the 1.3100 area.
If bulls push prices higher and achieve a daily close above the previously mentioned key resistance level, it will open the door for further upside.
That outcome will expose the October 4 high at 1.3175. Next will be the 1.3200 figure, followed by the August 27 daily high of 1.3266, ahead of the 1.3300 mark.
Conversely, if GBP/USD tumbles below 1.3100 and achieves a daily close below the latter, sellers will have the upper hand and can challenge the current week low of 1.3058 before targeting the September 11 cycle low of 1.3001.
GBP/USD Price Action – Daily Chart
British Pound PRICE Today
The table below shows the percentage change of British Pound (GBP) against listed major currencies today. British Pound was the strongest against the Australian Dollar.
| USD | EUR | GBP | JPY | CAD | AUD | NZD | CHF | |
|---|---|---|---|---|---|---|---|---|
| USD | 0.07% | 0.00% | 0.06% | 0.41% | 0.50% | 0.26% | 0.40% | |
| EUR | -0.07% | -0.06% | -0.02% | 0.34% | 0.41% | 0.17% | 0.33% | |
| GBP | -0.00% | 0.06% | 0.06% | 0.38% | 0.49% | 0.23% | 0.39% | |
| JPY | -0.06% | 0.02% | -0.06% | 0.47% | 0.45% | 0.18% | 0.36% | |
| CAD | -0.41% | -0.34% | -0.38% | -0.47% | 0.09% | -0.14% | 0.00% | |
| AUD | -0.50% | -0.41% | -0.49% | -0.45% | -0.09% | -0.25% | -0.09% | |
| NZD | -0.26% | -0.17% | -0.23% | -0.18% | 0.14% | 0.25% | 0.16% | |
| CHF | -0.40% | -0.33% | -0.39% | -0.36% | -0.00% | 0.09% | -0.16% |
The heat map shows percentage changes of major currencies against each other. The base currency is picked from the left column, while the quote currency is picked from the top row. For example, if you pick the British Pound from the left column and move along the horizontal line to the US Dollar, the percentage change displayed in the box will represent GBP (base)/USD (quote).
Author

Christian Borjon Valencia
FXStreet
Markets analyst, news editor, and trading instructor with over 14 years of experience across FX, commodities, US equity indices, and global macro markets.


