GBP/USD Price Forecast: Dips under 1.2700 despite hot UK inflation
- GBP/USD slides to 1.2695, under pressure from a strengthening US Dollar and a 'death cross' technical formation.
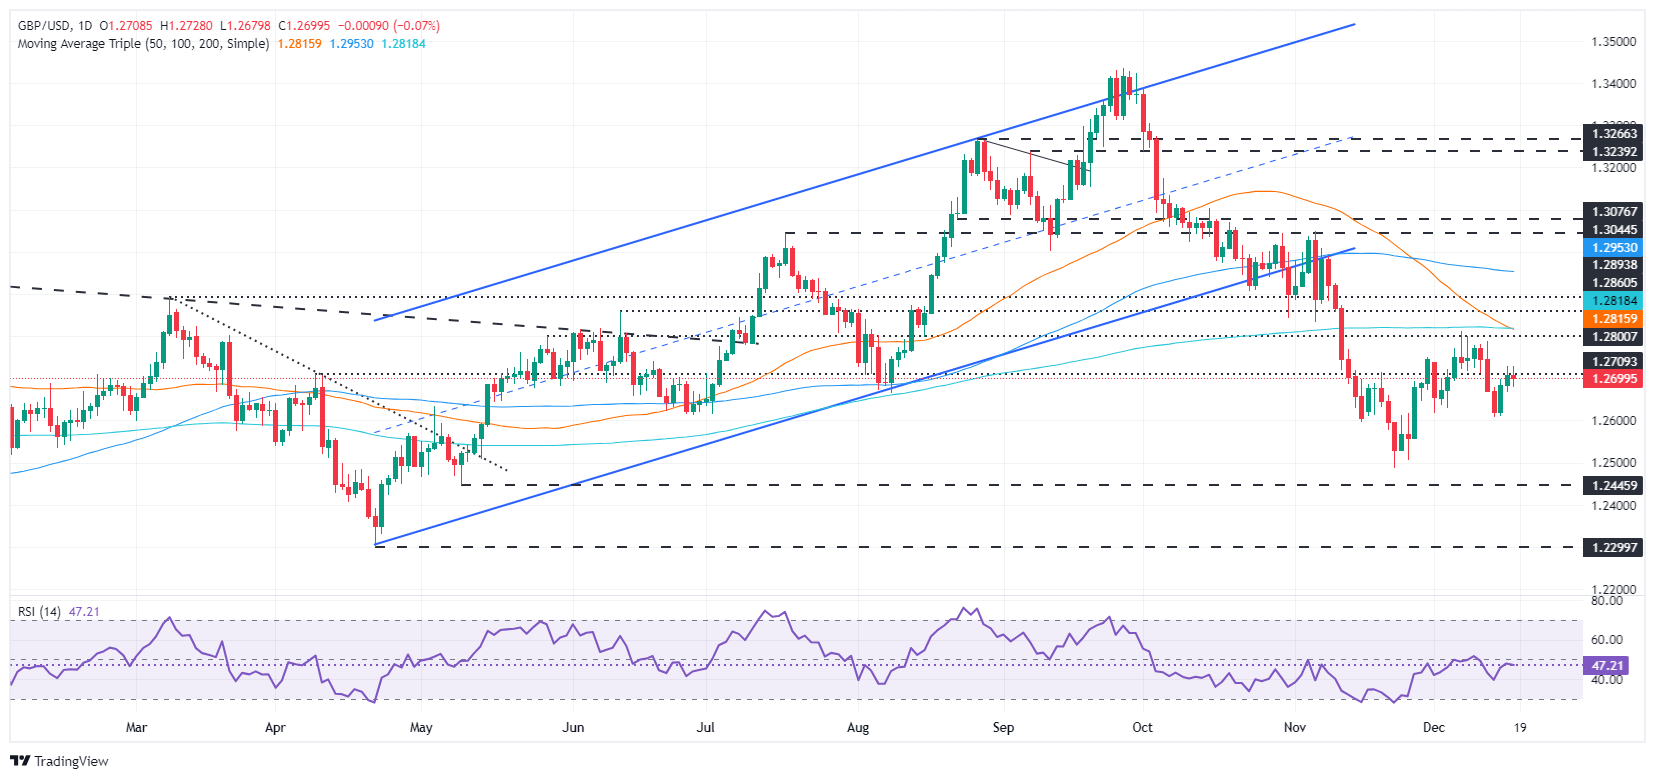
- Key support levels for GBP/USD set at 1.2665 and 1.2605, with further downside risk to the November low of 1.2486.
- Upside resistance seen near 1.2814/16, where the 50-day and 200-day SMAs converge, extending to the 100-day SMA at 1.2893.

The Pound Sterling lost some ground against the US Dollar on Wednesday even though UK inflation data for November was higher than in the previous month. This and expansionary fiscal policy might prevent the Bank of England from cutting rates, although the economy has shown some signs of weakness. The GBP/USD trades at 1.2695, failing to clear the 1.2700 mark decisively.
GBP/USD Price Forecast: Technical outlook
Price action suggests that further US Dollar strength may weigh on the GBP/USD. The 50-day Simple Moving Average (SMA) dropped below the 200-day SMA, confirming the formation of a ‘death cross,’ indicating further downside.
The Relative Strength Index (RSI) shows that sellers are in charge as the RSI aims lower in bearish territory,
That said, GBP/USD's first support would be the December 17 low of 1.2665. If cleared, it will clear the path to test 1.2605, the December 13 law, followed by the November 22 cycle low of 1.2486.
On the other hand, if GBP/USD climbs above 1.2700, buyers must climb above the 1.2814/16 area, the confluence of the 50 and 200-day SMAs. Once surpassed, they could challenge the 100-day SMA at around 1.2893.
GBP/USD Price Chart – Daily
British Pound PRICE Today
The table below shows the percentage change of British Pound (GBP) against listed major currencies today. British Pound was the strongest against the New Zealand Dollar.
| USD | EUR | GBP | JPY | CAD | AUD | NZD | CHF | |
|---|---|---|---|---|---|---|---|---|
| USD | -0.06% | 0.07% | 0.18% | -0.03% | 0.17% | 0.31% | 0.09% | |
| EUR | 0.06% | 0.12% | 0.27% | 0.02% | 0.22% | 0.37% | 0.14% | |
| GBP | -0.07% | -0.12% | 0.12% | -0.10% | 0.10% | 0.24% | 0.02% | |
| JPY | -0.18% | -0.27% | -0.12% | -0.24% | -0.03% | 0.10% | -0.11% | |
| CAD | 0.03% | -0.02% | 0.10% | 0.24% | 0.20% | 0.34% | 0.12% | |
| AUD | -0.17% | -0.22% | -0.10% | 0.03% | -0.20% | 0.14% | -0.08% | |
| NZD | -0.31% | -0.37% | -0.24% | -0.10% | -0.34% | -0.14% | -0.22% | |
| CHF | -0.09% | -0.14% | -0.02% | 0.11% | -0.12% | 0.08% | 0.22% |
The heat map shows percentage changes of major currencies against each other. The base currency is picked from the left column, while the quote currency is picked from the top row. For example, if you pick the British Pound from the left column and move along the horizontal line to the US Dollar, the percentage change displayed in the box will represent GBP (base)/USD (quote).
Author

Christian Borjon Valencia
FXStreet
Markets analyst, news editor, and trading instructor with over 14 years of experience across FX, commodities, US equity indices, and global macro markets.


