GBP/USD Price Forecast: Dips to 1.2700, ignores BoE’s hawkish comments
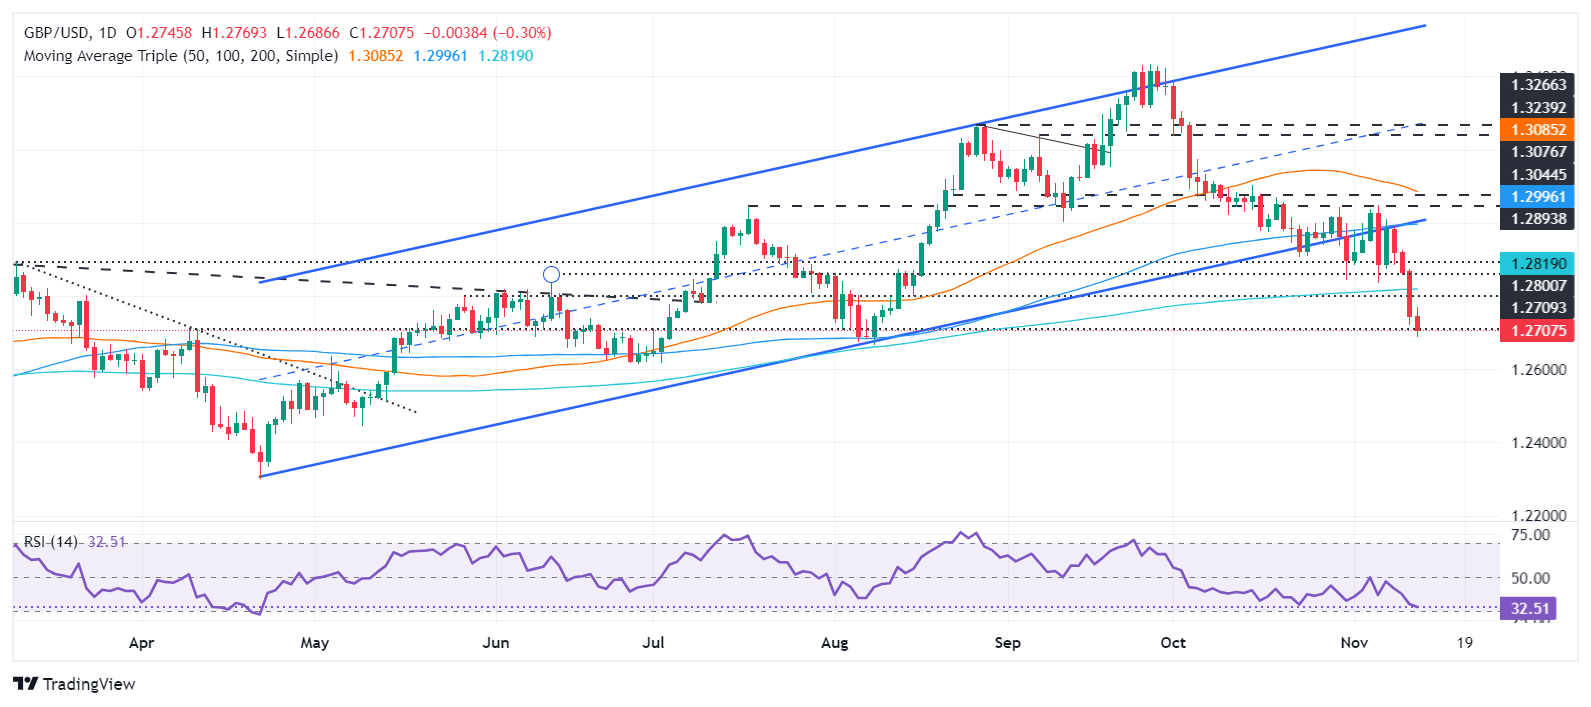
- GBP/USD extends losses, breaking below the 200-day SMA, with further downside potential.
- Technical indicators suggest continuing bearish momentum with support at 1.2665 in focus.
- Recovery above 1.2700 could test resistance at the recent high of 1.2873.

The Pound Sterling registers losses against the US Dollar in early trading during the North American session, sponsored by Bank of England´s (BoE) Catherine Mann's hawkish rhetoric. This and the latest US inflation report came as expected, keeping the GBP/USD trading at around 1.2697, down by over 0.37%.
GBP/USD Price Forecast: Technical outlook
The GBP/USD bearish momentum extended after the pair cleared 1.2817, the 200-day Simple Moving Average (SMA), opening the door to challenge 1.2800. Momentum remains tilted to the downside, with the pair hitting a daily low of 1.2686, shy of testing intermediate support seen at the August 8 swing low of 1.2665. If cleared, the next support would be the 1.2600 figure.
Conversely, buyers must push the exchange rate toward 1.2700. If surpassed, the next stop would be the November 12 high at 1.2873.
Oscillators such as the Relative Strength Index (RSI) hints that sellers are in charge. Therefore, further GBP/USD downside is seen.
GBP/USD Price Chart – Daily
Pound Sterling FAQs
The Pound Sterling (GBP) is the oldest currency in the world (886 AD) and the official currency of the United Kingdom. It is the fourth most traded unit for foreign exchange (FX) in the world, accounting for 12% of all transactions, averaging $630 billion a day, according to 2022 data. Its key trading pairs are GBP/USD, also known as ‘Cable’, which accounts for 11% of FX, GBP/JPY, or the ‘Dragon’ as it is known by traders (3%), and EUR/GBP (2%). The Pound Sterling is issued by the Bank of England (BoE).
The single most important factor influencing the value of the Pound Sterling is monetary policy decided by the Bank of England. The BoE bases its decisions on whether it has achieved its primary goal of “price stability” – a steady inflation rate of around 2%. Its primary tool for achieving this is the adjustment of interest rates. When inflation is too high, the BoE will try to rein it in by raising interest rates, making it more expensive for people and businesses to access credit. This is generally positive for GBP, as higher interest rates make the UK a more attractive place for global investors to park their money. When inflation falls too low it is a sign economic growth is slowing. In this scenario, the BoE will consider lowering interest rates to cheapen credit so businesses will borrow more to invest in growth-generating projects.
Data releases gauge the health of the economy and can impact the value of the Pound Sterling. Indicators such as GDP, Manufacturing and Services PMIs, and employment can all influence the direction of the GBP. A strong economy is good for Sterling. Not only does it attract more foreign investment but it may encourage the BoE to put up interest rates, which will directly strengthen GBP. Otherwise, if economic data is weak, the Pound Sterling is likely to fall.
Another significant data release for the Pound Sterling is the Trade Balance. This indicator measures the difference between what a country earns from its exports and what it spends on imports over a given period. If a country produces highly sought-after exports, its currency will benefit purely from the extra demand created from foreign buyers seeking to purchase these goods. Therefore, a positive net Trade Balance strengthens a currency and vice versa for a negative balance.
Author

Christian Borjon Valencia
FXStreet
Markets analyst, news editor, and trading instructor with over 14 years of experience across FX, commodities, US equity indices, and global macro markets.


