|

GBP/USD Price Analysis: Under pressure below weekly falling trendline

  • GBP/USD fails to hold onto recovery gains beyond the short-term resistance line.
  • The monthly low is in the spotlight, 61.8% Fibonacci retracement acts as the key resistance.
  • The bears dominate amid US dollar strength, nearly oversold RSI conditions can challenge the sellers.

With the broad US dollar strength in place, GBP/USD drops 0.60% to 1.1550 during Monday’s Asian session.

In doing so, the Cable pair extends its U-turn from the one-week-old falling trend line, which in turn signals the revisit to the monthly low near 1.1410.

Should there be a further downside past-1.1410, also breaking below 1.1400 round-figure, the bears might extend the journey towards 1.1100 area.

However, nearly oversold RSI conditions seem to challenge the bears and hence buyers can take entry on the break of the trend line resistance, currently near 1.1885.

As a result, 1.2000 and 61.8% Fibonacci retracement of March 09-19 fall, near 1.2517 will gain the market’s attention.

GBP/USD four-hour chart
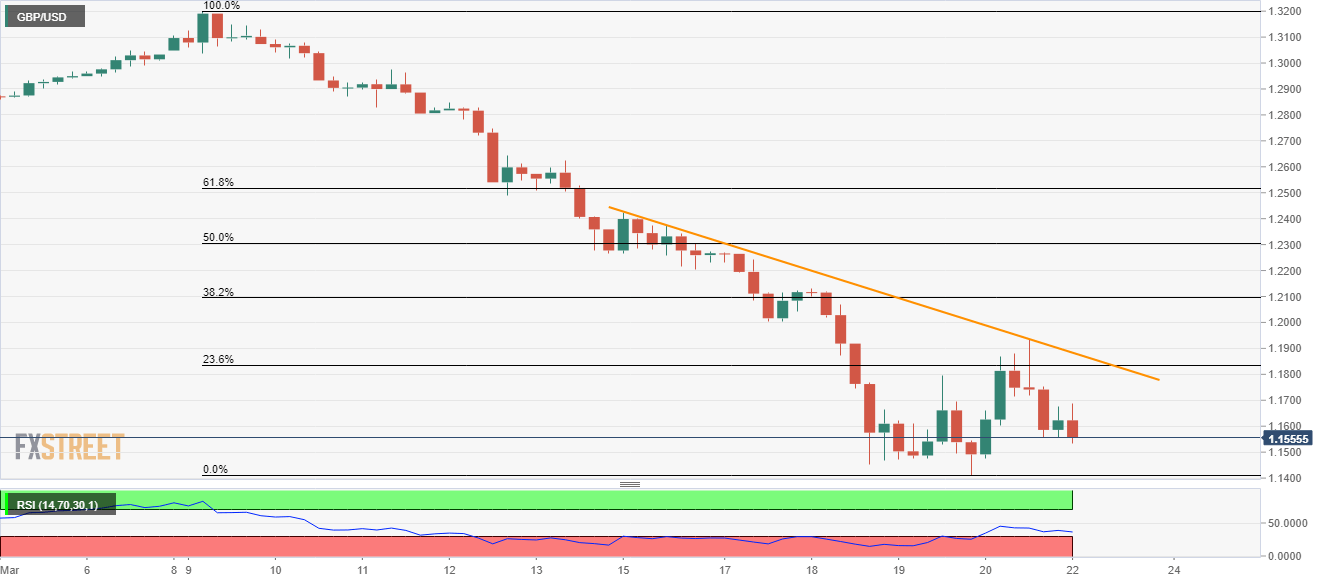
Trend: Bearish

Additional important levels

Overview
Today last price1.1538
Today Daily Change-85 pips
Today Daily Change %-0.73%
Today daily open1.1623
 
Trends
Daily SMA201.2587
Daily SMA501.2843
Daily SMA1001.293
Daily SMA2001.2686
 
Levels
Previous Daily High1.1935
Previous Daily Low1.1412
Previous Weekly High1.24
Previous Weekly Low1.1412
Previous Monthly High1.3204
Previous Monthly Low1.2726
Daily Fibonacci 38.2%1.1735
Daily Fibonacci 61.8%1.1612
Daily Pivot Point S11.1378
Daily Pivot Point S21.1133
Daily Pivot Point S31.0855
Daily Pivot Point R11.1901
Daily Pivot Point R21.218
Daily Pivot Point R31.2424

Author

Anil Panchal

Anil Panchal

FXStreet

Anil Panchal has nearly 15 years of experience in tracking financial markets. With a keen interest in macroeconomics, Anil aptly tracks global news/updates and stays well-informed about the global financial moves and their implications.

More from Anil Panchal
Share:

Editor's Picks

EUR/USD flirts with daily highs, retargets 1.1900

EUR/USD regains upside traction, returning to the 1.1880 zone and refocusing its attention to the key 1.1900 barrier. The pair’s slight gains comes against the backdrop of a humble decline in the US Dollar as investors continue to assess the latest US CPI readings and the potential Fed’s rate path.

GBP/USD remains well bid around 1.3650

GBP/USD maintains its upside momentum in place, hovering around daily highs near 1.3650 and setting aside part of the recent three-day drop. Cable’s improved sentiment comes on the back of the Greenback’s  irresolute price action, while recent hawkish comments from the BoE’s Pill also collaborate with the uptick.

Gold clings to gains just above $5,000/oz

Gold is reclaiming part of the ground lost on Wednesday’s marked decline, as bargain-hunters keep piling up and lifting prices past the key $5,000 per troy ounce. The precious metal’s move higher is also underpinned by the slight pullback in the US Dollar and declining US Treasury yields across the curve.

Crypto Today: Bitcoin, Ethereum, XRP in choppy price action, weighed down by falling institutional interest 

Bitcoin's upside remains largely constrained amid weak technicals and declining institutional interest. Ethereum trades sideways above $1,900 support with the upside capped below $2,000 amid ETF outflows.

Week ahead – Data blitz, Fed Minutes and RBNZ decision in the spotlight

US GDP and PCE inflation are main highlights, plus the Fed minutes. UK and Japan have busy calendars too with focus on CPI. Flash PMIs for February will also be doing the rounds. RBNZ meets, is unlikely to follow RBA’s hawkish path.

Ripple Price Forecast: XRP potential bottom could be in sight

Ripple edges up above the intraday low of $1.35 at the time of writing on Friday amid mixed price actions across the crypto market. The remittance token failed to hold support at $1.40 the previous day, reflecting risk-off sentiment amid a decline in retail and institutional sentiment. 

GBP/USD Price Analysis: Under pressure below weekly falling trendline