• GBP/USD jumps above 1.2700 on softer US data, yet the pair remains sideways.
  • Key resistance emerges at 1.2761, 1.2800, and the YTD high near 1.2900.
  • Support is seen at 1.2700, 1.2674, and the confluence of May 3 high and 100-DMA.

The British Pound erases some of its previous losses against the US Dollar and rises some 0.29%, as the GBP/USD aims above 1.2700 after bouncing off a daily low of 1.2674. Data from the United States (US) was cheered by market participants and weighed on the safe-haven peers, like the Greenback.

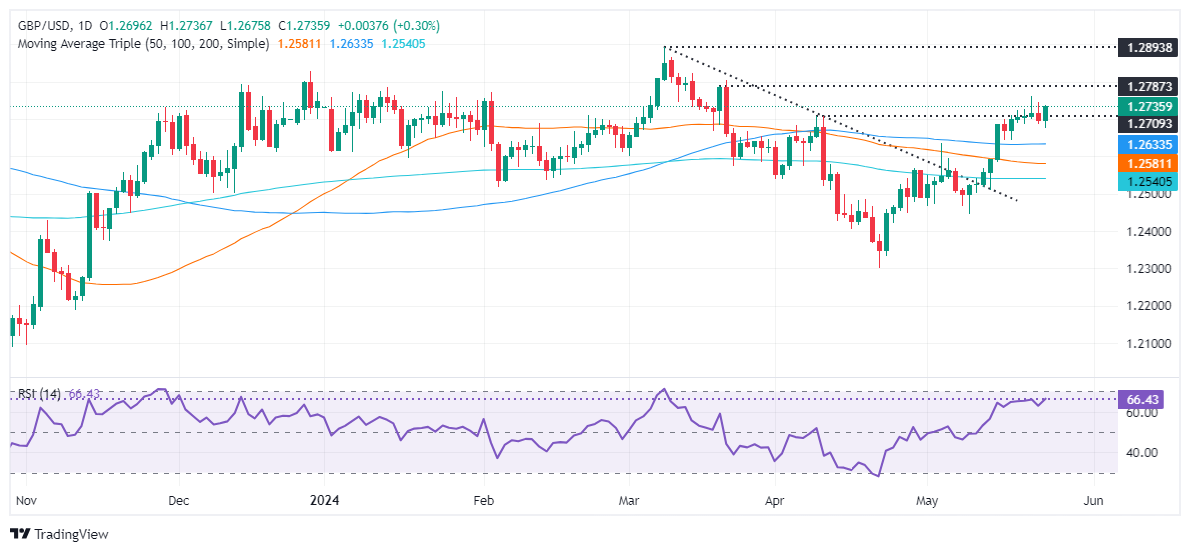
GBP/USD Price Analysis: Technical outlook

The GBP/USD remains in consolidation, within the 1.2670-1.2760 during the week, unable to decisively breach the range. Still, buyers remain in charge as depicted by the Relative Strength Index (RSI) standing in bullish territory, yet almost flat.

For a bullish continuation, the major should clear 1.2760, which will expose the 1.2800 figure. Further strength would pave the way to test a year-to-date (YTD) high of 1.2893, followed by 1.2900.

Conversely, if bears stepped in, they must clear 1.2700 and the May 23 low of 1.2674. In that event, the Bulls’ next line of defense would be the confluence of the 100-day moving average (DMA) and the May 3 high-turned support at 1.2634 before the GBP/USD tumbles to 1.2600.

GBP/USD Price Action – Daily Chart

GBP/USD

Overview
Today last price 1.2734
Today Daily Change 0.0036
Today Daily Change % 0.28
Today daily open 1.2698
 
Trends
Daily SMA20 1.2591
Daily SMA50 1.2581
Daily SMA100 1.2633
Daily SMA200 1.2541
 
Levels
Previous Daily High 1.2747
Previous Daily Low 1.2686
Previous Weekly High 1.2712
Previous Weekly Low 1.2509
Previous Monthly High 1.2709
Previous Monthly Low 1.23
Daily Fibonacci 38.2% 1.2709
Daily Fibonacci 61.8% 1.2723
Daily Pivot Point S1 1.2674
Daily Pivot Point S2 1.2649
Daily Pivot Point S3 1.2612
Daily Pivot Point R1 1.2735
Daily Pivot Point R2 1.2771
Daily Pivot Point R3 1.2796


British Pound PRICE Today

The table below shows the percentage change of British Pound (GBP) against listed major currencies today. British Pound was the strongest against the Japanese Yen.

  USD EUR GBP JPY CAD AUD NZD CHF
USD   -0.31% -0.31% 0.05% -0.41% -0.29% -0.25% 0.02%
EUR 0.31%   0.00% 0.32% -0.13% 0.01% 0.06% 0.32%
GBP 0.31% -0.00%   0.32% -0.12% 0.03% 0.05% 0.31%
JPY -0.05% -0.32% -0.32%   -0.43% -0.32% -0.28% -0.03%
CAD 0.41% 0.13% 0.12% 0.43%   0.11% 0.17% 0.42%
AUD 0.29% -0.01% -0.03% 0.32% -0.11%   0.03% 0.30%
NZD 0.25% -0.06% -0.05% 0.28% -0.17% -0.03%   0.25%
CHF -0.02% -0.32% -0.31% 0.03% -0.42% -0.30% -0.25%  

The heat map shows percentage changes of major currencies against each other. The base currency is picked from the left column, while the quote currency is picked from the top row. For example, if you pick the British Pound from the left column and move along the horizontal line to the US Dollar, the percentage change displayed in the box will represent GBP (base)/USD (quote).


Share: Feed news

Information on these pages contains forward-looking statements that involve risks and uncertainties. Markets and instruments profiled on this page are for informational purposes only and should not in any way come across as a recommendation to buy or sell in these assets. You should do your own thorough research before making any investment decisions. FXStreet does not in any way guarantee that this information is free from mistakes, errors, or material misstatements. It also does not guarantee that this information is of a timely nature. Investing in Open Markets involves a great deal of risk, including the loss of all or a portion of your investment, as well as emotional distress. All risks, losses and costs associated with investing, including total loss of principal, are your responsibility. The views and opinions expressed in this article are those of the authors and do not necessarily reflect the official policy or position of FXStreet nor its advertisers. The author will not be held responsible for information that is found at the end of links posted on this page.

If not otherwise explicitly mentioned in the body of the article, at the time of writing, the author has no position in any stock mentioned in this article and no business relationship with any company mentioned. The author has not received compensation for writing this article, other than from FXStreet.

FXStreet and the author do not provide personalized recommendations. The author makes no representations as to the accuracy, completeness, or suitability of this information. FXStreet and the author will not be liable for any errors, omissions or any losses, injuries or damages arising from this information and its display or use. Errors and omissions excepted.

The author and FXStreet are not registered investment advisors and nothing in this article is intended to be investment advice.

Recommended content


Recommended content

Editors’ Picks

AUD/USD Price Analysis: Sideways trend continues unfolding

AUD/USD Price Analysis: Sideways trend continues unfolding

AUD/USD is in a down-leg within a narrow trading range. The pair is probably in a sideways trend with the odds favoring an extension of that trend. A decisive break above or below the top or bottom of the range would generate follow-through targets. 

AUD/USD News

EUR/USD: Central banks’ decisions will keep taking their toll

EUR/USD: Central banks’ decisions will keep taking their toll

The EUR/USD pair slid below the 1.0700 mark for the first time in over a month on Friday, as the US Dollar surged on the back of risk aversion. The dismal mood prevailed throughout the week, with a short-lived exception on Wednesday when softer-than-anticipated United States inflation brought a breath of fresh air.

EUR/USD News

Gold gains ground as traders dial up Fed rate cut bets for September

Gold gains ground as traders dial up Fed rate cut bets for September

Gold registered limited gains this week, supported by safe-haven flows and soft inflation data from the US. In the absence of high-impact macroeconomic data releases ahead, investors will pay close attention to technical developments in XAU/USD and comments from Federal Reserve officials. 

Gold News

Bitcoin active addresses hit lowest level in five years, BTC ranges below $67,000

Bitcoin active addresses hit lowest level in five years, BTC ranges below $67,000

Bitcoin, the largest asset by market capitalization, has noted a decline in its active address count per data from Glassnode. A decline in active addresses is typical at a time during a surge in Bitcoin transaction fees.

Read more

Week ahead: RBA, SNB and BoE next to decide, CPI and PMI data also on tap

Week ahead: RBA, SNB and BoE next to decide, CPI and PMI data also on tap

It will be another central-bank-heavy week with the RBA, SNB and BoE. Retail sales will be the highlight in the United States. Plenty of other data also on the way, including flash PMIs and UK CPI.

Read more

Forex MAJORS

Cryptocurrencies

Signatures