|

GBP/USD Price Analysis: Stays defensive above monthly support near 1.2000

  • GBP/USD struggles to keep the bounce off one-month-old ascending support line.
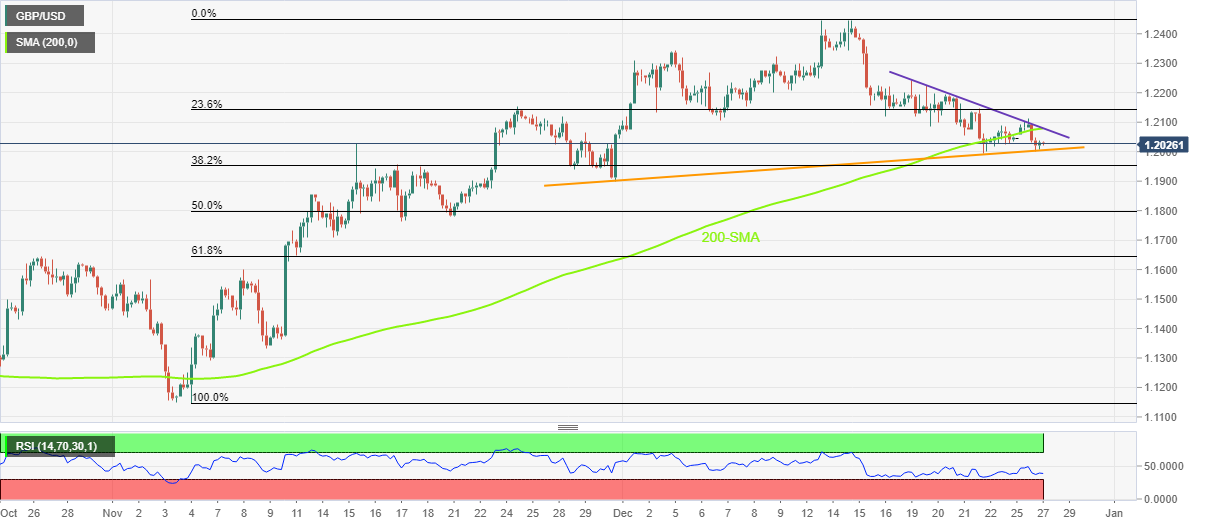
  • Sustained downside break of 200-SMA, downbeat RSI conditions keep sellers hopeful.
  • The 1.2080 resistance confluence restricts immediate recovery moves.

GBP/USD stays defensive around 1.2030, fading the bounce off the monthly support line, as bears await fresh clues to retake control during early Wednesday.

That said, an upward-sloping support line from November 30, around the 1.2000 psychological magnet by the press time, restricts the Cable pair’s short-term downside.

However, the latest successful break of the 200-SMA joins the downbeat RSI (14), not oversold, to keep bears hopeful of conquering the stated support and retaking control.

Following that, the monthly low of 1.1990 and the late November bottom surrounding 1.1900 could lure the GBP/USD sellers. Though, the 50% and 61.8% Fibonacci retracement levels of the pair’s November-December run-up, respectively near 1.1800 and 1.1645, could challenge the quote’s further declines.

It’s worth noting that the late October swing high adds strength to the 1.1645 support level.

Alternatively, a convergence of the 200-SMA and one-week-old descending trend line highlights the 1.2080 level as the key hurdle for the GBP/USD bulls.

In a case where the Cable buyers keep the reins past 1.2080, the previous weekly top near 1.2245 and the early December top close to 1.2345 could probe the upside momentum before highlighting the monthly peak of 1.2445 as the target for the GBP/USD bulls.

GBP/USD: Four-hour chart

Trend: Further downside expected

Additional important levels

Overview
Today last price1.2028
Today Daily Change-0.0018
Today Daily Change %-0.15%
Today daily open1.2046
 
Trends
Daily SMA201.2174
Daily SMA501.1844
Daily SMA1001.1672
Daily SMA2001.2069
 
Levels
Previous Daily High1.2046
Previous Daily Low1.2046
Previous Weekly High1.2242
Previous Weekly Low1.1992
Previous Monthly High1.2154
Previous Monthly Low1.1147
Daily Fibonacci 38.2%1.2046
Daily Fibonacci 61.8%1.2046
Daily Pivot Point S11.2046
Daily Pivot Point S21.2046
Daily Pivot Point S31.2046
Daily Pivot Point R11.2046
Daily Pivot Point R21.2046
Daily Pivot Point R31.2046

Author

Anil Panchal

Anil Panchal

FXStreet

Anil Panchal has nearly 15 years of experience in tracking financial markets. With a keen interest in macroeconomics, Anil aptly tracks global news/updates and stays well-informed about the global financial moves and their implications.

More from Anil Panchal
Share:

Editor's Picks

EUR/USD recovers above 1.1600 as focus shifts to US data

EUR/USD stages a modest rebound and trades in positive territory above 1.1600 in the European session on Wednesday. Improving risk sentiment makes it difficult for the US Dollar to preserve its strength and helps the pair edge higher as focus shifts to key US data releases.

GBP/USD climbs above 1.3350 on improving risk mood

GBP/USD gains traction and advances toward 1.3400 on Wednesday. Although there are no headlines pointing to a de-escalation in the Middle East conflict, the modest recovery seen in US stock index futures limit the USD's gains and help the pair hold its ground.

Gold rebounds toward $5,200 as USD retreats

Gold maintains its offered tone through European session on Wednesday and climbs to the $5,200 region. The downward correction seen in the US Dollar and the ongoing crsis in the Middle East seem to be allowing XAU/USD to preserve its recovery momentum.

Crypto Today: Bitcoin, Ethereum, XRP rebound amid mixed ETF flows

The cryptocurrency market is showing subtle recovery signs despite heightened global uncertainty following the United States (US) and Israel attacks on Iran and the subsequent retaliations that have morphed into a wider Middle East war.

Asian stocks fall as South Korea’s KOSPI slumps over 10%

Asian equities drop on Middle East tensions; the MSCI Asia Pacific Index falls up to 4%. South Korea’s KOSPI fell 10.71% near 5,170, with the Korean Won weakened past 1,500 per dollar.

Solana Price Forecast: SOL consolidation near resistance as ETF inflows offer mild support

Solana price is facing slight rejection as it approaches the upper boundary of the consolidation range at around $88 on Wednesday. Institutional demand is strengthening as spot Exchange Traded Funds recorded two consecutive inflows so far this week.