|

GBP/USD Price Analysis: Spikes to fresh session tops, retakes 1.3900 mark and beyond

  • GBP/USD caught some aggressive bids during the early European session.
  • The momentum pushed the pair back above the 1.3900 round-figure mark.

The GBP/USD pair rallied around 70 pips from the early European session lows near the 1.3840 region and refreshed daily tops in the last hour. Bulls are now be looking to build on the momentum further beyond the 1.3900 round-figure mark.

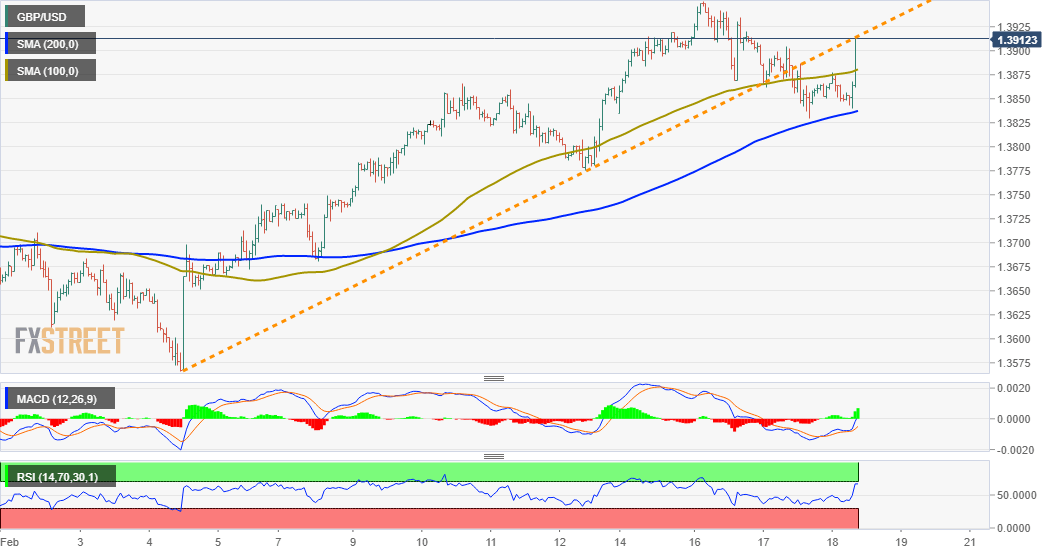
From a technical perspective, this week's pullback from 34-month tops, around mid-1.3900s dragged the GBP/USD pair below a near two-week-old ascending trend-line support on Wednesday. The corrective slide, however, stalled on Thursday and the pair managed to attract some dip-buying near 200-hour SMA.

The mentioned support is currently pegged near the 1.3835-30 region, which should now act as a key pivotal point for traders and help determine the GBP/USD pair's near-term trajectory.

Meanwhile, the intraday bounce pushed the GBP/USD pair back towards the mentioned trend-line support breakpoint, now turned resistance. A sustained move beyond will negate any near-term bearish bias and push the pair back towards the 1.3950 area, or the highest level since April 2018 touched on Tuesday.

On the flip side, the 100-hour SMA, around the 1.3880 region, now seems to protect the immediate downside. This is followed by support near the 1.3835 area (200-hour SMA), which if broken might prompt some technical selling and pave the way for a further near-term depreciating move.

The GBP/USD pair might then turn vulnerable to break below the 1.3800 mark. Any subsequent slide might still be seen as a buying opportunity and remain limited near the 1.3760-55 region.

GBP/USD 1-hourly chart

fxsoriginal

Technical levels to watch

GBP/USD

Overview
Today last price1.3912
Today Daily Change0.0048
Today Daily Change %0.35
Today daily open1.3864
 
Trends
Daily SMA201.3752
Daily SMA501.3622
Daily SMA1001.3379
Daily SMA2001.3065
 
Levels
Previous Daily High1.3911
Previous Daily Low1.383
Previous Weekly High1.3866
Previous Weekly Low1.368
Previous Monthly High1.3759
Previous Monthly Low1.3451
Daily Fibonacci 38.2%1.3861
Daily Fibonacci 61.8%1.388
Daily Pivot Point S11.3825
Daily Pivot Point S21.3787
Daily Pivot Point S31.3744
Daily Pivot Point R11.3906
Daily Pivot Point R21.3949
Daily Pivot Point R31.3988

Author

Haresh Menghani

Haresh Menghani is a detail-oriented professional with 10+ years of extensive experience in analysing the global financial markets.

More from Haresh Menghani
Share:

Editor's Picks

EUR/USD challenges 1.1700, six-week lows

EUR/USD remains under heavy downside pressire in quite a dfrreadful start to the new trading week, putting the 1.1700 support to the test amid the marked rebound in the US Dollar. The flight-so-safety environment continues to support the Greenback following the escalating conflict in the Middle East.

GBP/USD hits new yearly lows near 1.3300

GBP/USD adds to the recent bearish tone, approaching to the key 1.3300 support to reach fresh YTD troughs against the backdrop of the robust performance of the US Dollar. Indeed, Cable’s decline comes amid the firm demand for the safe-haven space in the wake of the US and Israel attacks to Iran.

Gold shifts its attention to $5,600 on fligh-to-safety mood

Gold climbs to levels last seen in late January past the $5,400 mark per troy ounce on Monday. The yellow metal’s strong uptick remains fuelled by incresing geopolitical tensions in the Middle East and the consequent demand for safer assets.

Bitcoin on brink of breakdown amid US-Iran war

Bitcoin (BTC) remains under pressure near the key support level of $65,700. Trading at $66,400 at the time of writing on Monday, a breakdown below this critical level would suggest a deeper correction ahead.

The week ahead: Conflict in the Middle East jolts markets

Events in the Middle East are obviously dominating financial markets this morning. The Brent crude oil price is extending gains and is higher by more than 8%, stock futures are pointing lower and the gold price is higher by more than 2%. 

Pi Network Price Forecast: Core team offloads supply, weighing on PI recovery

Pi Network  hovers below $0.1700, broadly steady at press time on Monday, attempting a recovery after a 2% loss the previous day. Sunday’s decline aligned with nearly 49 million PI tokens offloaded by the Pi Foundation, implying a spike in supply pressure that capped the prevailing four-day recovery.