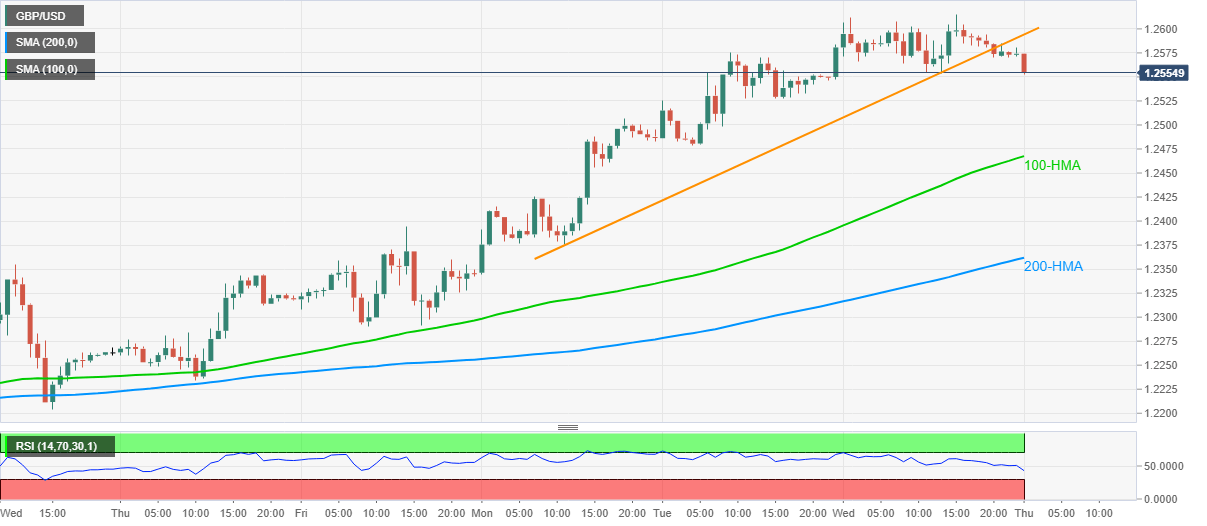
GBP/USD Price Analysis: Slips below 1.2600 on the break of immediate support line
- GBP/USD extends pullback from 1.2616, bears eye 100-HMA during further declines.
- April high will validate the pair’s strength beyond the recent top.
- A sustained break below 200-HMA will defy the pair bulls.

GBP/USD drops to 1.2556, down 0.14% on a day, amid the early Thursday’s Asian session. The pair recently broke the immediate support line while stepping back from the highest since April 30.
As a result, the quote is likely to remain downbeat and can extend the fall towards a 100-HMA level of 1.2468 during the further declines.
However, 200-HMA near 1.2360 could restrict the pair’s additional weakness past-1.2468, if not then the bears may challenge the previous month’s bottom surrounding 1.2075.
Alternatively, an upside clearance of the recent high of 1.2616 will have to cross April 30 top near 1.2650 to justify the strength of the bulls.
In doing so, the optimists may target February month low near 1.2725/30 to cheer the north-run.
GBP/USD hourly chart
Trend: Pullback expected
Author

Anil Panchal
FXStreet
Anil Panchal has nearly 15 years of experience in tracking financial markets. With a keen interest in macroeconomics, Anil aptly tracks global news/updates and stays well-informed about the global financial moves and their implications.


