GBP/USD Price Analysis: Sellers attack 1.2100 support during three-day downtrend


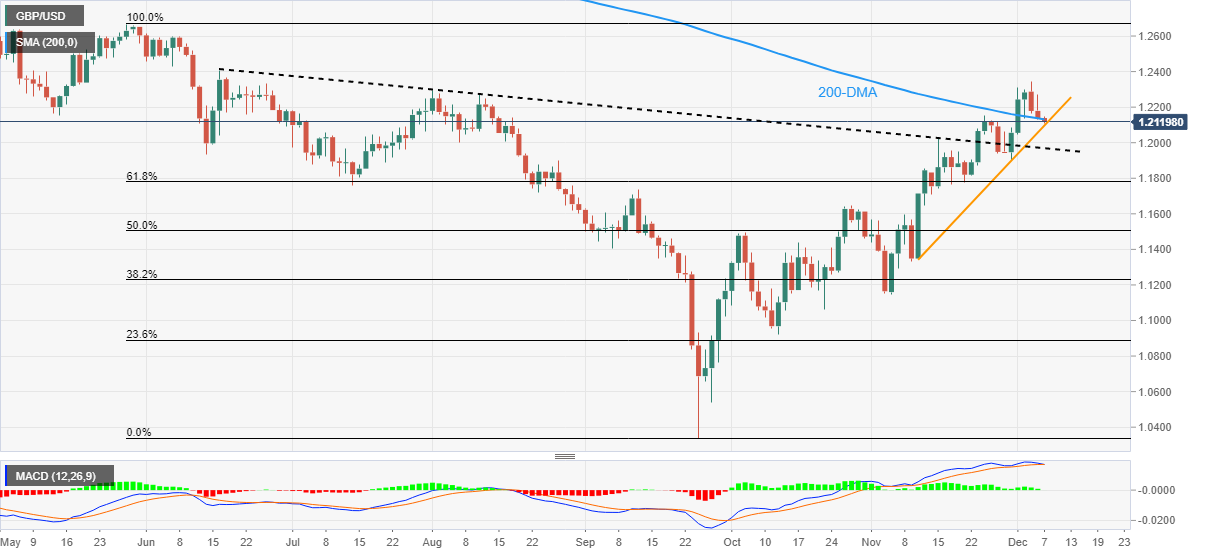
  • GBP/USD stays pressured around the short-term key support confluence.
  • Convergence of 200-DMA, one-month-old ascending trend line restricts immediate downside.
  • The looming bear cross on MACD keeps sellers hopeful, previous resistance line from June acts as additional downside filter.

GBP/USD bears keep the reins as they battle with the 1.2100 key support amid the early Wednesday morning in London. In doing so, the Cable pair drops for the third consecutive day.

That said, the looming bear cross on the MACD indicator hints at the quote’s further downside. However, the 200-DMA and an upward-sloping trend line from November 10 restrict the quote’s immediate declines.

In a case where the GBP/USD bears manage to post a daily close below 1.2100, the resistance-turned-support line from June, near 1.1965, could lure the sellers. It should be noted that the 1.2000 psychological magnet may act as a buffer during the fall.

If at all the GBP/USD price fails to reverse from 1.1965, the 61.8% Fibonacci retracement level of the May-September downside, near 1.1780, will be in focus while checking for the quote’s further weakness.

On the flip side, highs marked in August around 1.2300 and the monthly peak near 1.2345 could challenge immediate GBP/USD recovery.

Following that, the mid-June low near 1.2410 holds the key to the GBP/USD pair upside towards the mid-2022 high, close to 1.2665.

Overall, GBP/USD is likely to witness further downside but the room towards the south is bumpy.

GBP/USD: Daily chart

Trend: Further downside expected

Additional important levels

Overview
Today last price 1.2118
Today Daily Change -0.0021
Today Daily Change % -0.17%
Today daily open 1.2139
 
Trends
Daily SMA20 1.1949
Daily SMA50 1.1561
Daily SMA100 1.1659
Daily SMA200 1.2137
 
Levels
Previous Daily High 1.227
Previous Daily Low 1.2133
Previous Weekly High 1.2311
Previous Weekly Low 1.19
Previous Monthly High 1.2154
Previous Monthly Low 1.1147
Daily Fibonacci 38.2% 1.2185
Daily Fibonacci 61.8% 1.2218
Daily Pivot Point S1 1.2091
Daily Pivot Point S2 1.2044
Daily Pivot Point S3 1.1955
Daily Pivot Point R1 1.2228
Daily Pivot Point R2 1.2317
Daily Pivot Point R3 1.2364


Share: Feed news

Information on these pages contains forward-looking statements that involve risks and uncertainties. Markets and instruments profiled on this page are for informational purposes only and should not in any way come across as a recommendation to buy or sell in these assets. You should do your own thorough research before making any investment decisions. FXStreet does not in any way guarantee that this information is free from mistakes, errors, or material misstatements. It also does not guarantee that this information is of a timely nature. Investing in Open Markets involves a great deal of risk, including the loss of all or a portion of your investment, as well as emotional distress. All risks, losses and costs associated with investing, including total loss of principal, are your responsibility. The views and opinions expressed in this article are those of the authors and do not necessarily reflect the official policy or position of FXStreet nor its advertisers. The author will not be held responsible for information that is found at the end of links posted on this page.

If not otherwise explicitly mentioned in the body of the article, at the time of writing, the author has no position in any stock mentioned in this article and no business relationship with any company mentioned. The author has not received compensation for writing this article, other than from FXStreet.

FXStreet and the author do not provide personalized recommendations. The author makes no representations as to the accuracy, completeness, or suitability of this information. FXStreet and the author will not be liable for any errors, omissions or any losses, injuries or damages arising from this information and its display or use. Errors and omissions excepted.

The author and FXStreet are not registered investment advisors and nothing in this article is intended to be investment advice.

Recommended content


Recommended content

Editors’ Picks

EUR/USD fluctuates in daily range above 1.0600

EUR/USD fluctuates in daily range above 1.0600

EUR/USD struggles to gather directional momentum and continues to fluctuate above 1.0600 on Tuesday. The modest improvement seen in risk mood limits the US Dollar's gains as investors await Fed Chairman Jerome Powell's speech.

EUR/USD News

GBP/USD stabilizes near 1.2450 ahead of Powell speech

GBP/USD stabilizes near 1.2450 ahead of Powell speech

GBP/USD holds steady at around 1.2450 after recovering from the multi-month low it touched near 1.2400 in the European morning. The USD struggles to gather strength after disappointing housing data. Market focus shifts to Fed Chairman Powell's appearance.

GBP/USD News

Gold retreats to $2,370 as US yields push higher

Gold retreats to $2,370 as US yields push higher

Gold stages a correction on Tuesday and fluctuates in negative territory near $2,370 following Monday's upsurge. The benchmark 10-year US Treasury bond yield continues to push higher above 4.6% and makes it difficult for XAU/USD to gain traction.

Gold News

XRP struggles below $0.50 resistance as SEC vs. Ripple lawsuit likely to enter final pretrial conference

XRP struggles below $0.50 resistance as SEC vs. Ripple lawsuit likely to enter final pretrial conference

XRP is struggling with resistance at $0.50 as Ripple and the US Securities and Exchange Commission (SEC) are gearing up for the final pretrial conference on Tuesday at a New York court. 

Read more

US outperformance continues

US outperformance continues

The economic divergence between the US and the rest of the world has become increasingly pronounced. The latest US inflation prints highlight that underlying inflation pressures seemingly remain stickier than in most other parts of the world.

Read more

Forex MAJORS

Cryptocurrencies

Signatures