GBP/USD Price Analysis: Remains stuck between two key averages, downside favored


  • GBP/USD extends range play around 1.3350 amid light trading.
  • The cable remains supported as DXY weakness offsets Brexit woes.
  • RSI is sitting just beneath the midline, favoring the downside.

GBP/USD is defending minor bids while wavering around 1.3350 so far this Thursday, as it lacks trading impetus amid a Thanksgiving Day holiday in the US.

The US dollar remains sluggish across its major peers, correcting some of its previous gains and lending support to the cable. Meanwhile, ongoing Brexit concerns, with France's pledge to continue its row over fishing rights with the UK, cap the upside attempts in the major.

Markets now look forward to Bank of England (BOE) Governor Andrew Bailey’s appearance scheduled later this Thursday for fresh insights on the central bank’s rate hike outlook.

Looking at GBP/USD’s hourly chart, the bull-bear tug-of-war is seen extending between the bearish 50-Hourly Moving Average (HMA) and the descending 21-HMA, which are placed at 1.3357 and 1.3337 respectively.

A breakout in either direction is needed to trigger some action in the cable, which is trading lackluster since mid-Asia.

However, with the Relative Strength Index (RSI) still holding below the midline, the downside appears more favored.

An hourly closing below the 21-HMA support will fuel a fresh drop towards the 11-month troughs of 1.3316.

Deeper declines could threaten the 1.3300 level.

GBP/USD: Hourly chart

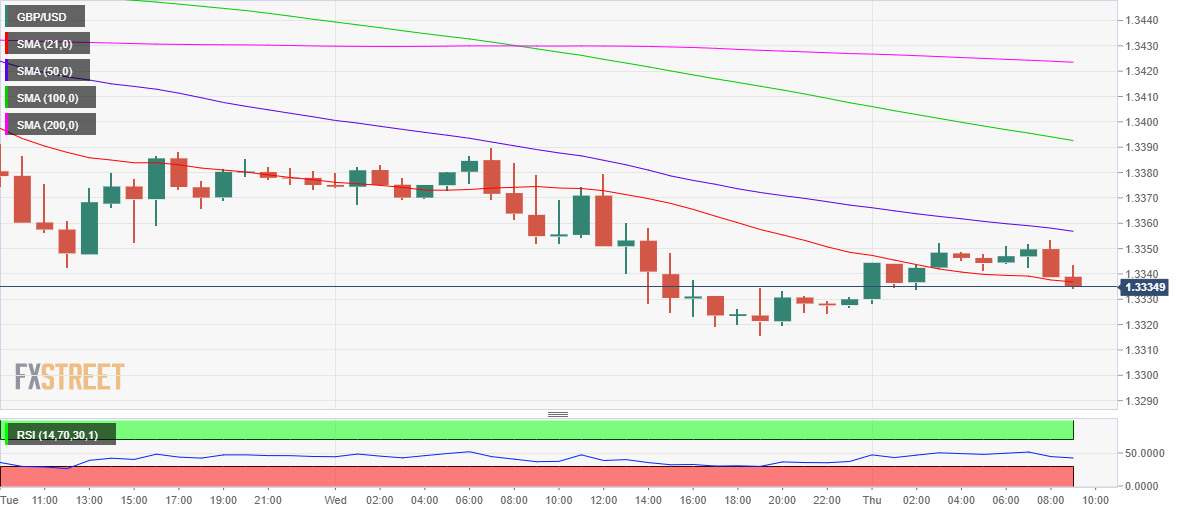
Alternatively, acceptance above 50-HMA is critical to extending the recovery momentum towards 1.3400.

The next significant resistance awaits at the 1.3450 psychological mark.

GBP/USD: Additional levels to consider

GBP/USD

Overview
Today last price 1.3339
Today Daily Change 0.0008
Today Daily Change % 0.06
Today daily open 1.3331
 
Trends
Daily SMA20 1.3506
Daily SMA50 1.3603
Daily SMA100 1.3706
Daily SMA200 1.3827
 
Levels
Previous Daily High 1.339
Previous Daily Low 1.3316
Previous Weekly High 1.3514
Previous Weekly Low 1.3396
Previous Monthly High 1.3834
Previous Monthly Low 1.3434
Daily Fibonacci 38.2% 1.3344
Daily Fibonacci 61.8% 1.3362
Daily Pivot Point S1 1.3301
Daily Pivot Point S2 1.3271
Daily Pivot Point S3 1.3227
Daily Pivot Point R1 1.3375
Daily Pivot Point R2 1.342
Daily Pivot Point R3 1.3449


Share: Feed news

Information on these pages contains forward-looking statements that involve risks and uncertainties. Markets and instruments profiled on this page are for informational purposes only and should not in any way come across as a recommendation to buy or sell in these assets. You should do your own thorough research before making any investment decisions. FXStreet does not in any way guarantee that this information is free from mistakes, errors, or material misstatements. It also does not guarantee that this information is of a timely nature. Investing in Open Markets involves a great deal of risk, including the loss of all or a portion of your investment, as well as emotional distress. All risks, losses and costs associated with investing, including total loss of principal, are your responsibility. The views and opinions expressed in this article are those of the authors and do not necessarily reflect the official policy or position of FXStreet nor its advertisers. The author will not be held responsible for information that is found at the end of links posted on this page.

If not otherwise explicitly mentioned in the body of the article, at the time of writing, the author has no position in any stock mentioned in this article and no business relationship with any company mentioned. The author has not received compensation for writing this article, other than from FXStreet.

FXStreet and the author do not provide personalized recommendations. The author makes no representations as to the accuracy, completeness, or suitability of this information. FXStreet and the author will not be liable for any errors, omissions or any losses, injuries or damages arising from this information and its display or use. Errors and omissions excepted.

The author and FXStreet are not registered investment advisors and nothing in this article is intended to be investment advice.

Recommended content


Recommended content

Editors’ Picks

EUR/USD clings to daily gains above 1.0650

EUR/USD clings to daily gains above 1.0650

EUR/USD gained traction and turned positive on the day above 1.0650. The improvement seen in risk mood following the earlier flight to safety weighs on the US Dollar ahead of the weekend and helps the pair push higher.

EUR/USD News

GBP/USD recovers toward 1.2450 after UK Retail Sales data

GBP/USD recovers toward 1.2450 after UK Retail Sales data

GBP/USD reversed its direction and advanced to the 1.2450 area after touching a fresh multi-month low below 1.2400 in the Asian session. The positive shift seen in risk mood on easing fears over a deepening Iran-Israel conflict supports the pair.

GBP/USD News

Gold holds steady at around $2,380 following earlier spike

Gold holds steady at around $2,380 following earlier spike

Gold stabilized near $2,380 after spiking above $2,400 with the immediate reaction to reports of Israel striking Iran. Meanwhile, the pullback seen in the US Treasury bond yields helps XAU/USD hold its ground.

Gold News

Bitcoin Weekly Forecast: BTC post-halving rally could be partially priced in Premium

Bitcoin Weekly Forecast: BTC post-halving rally could be partially priced in

Bitcoin price shows no signs of directional bias while it holds above  $60,000. The fourth BTC halving is partially priced in, according to Deutsche Bank’s research. 

Read more

Week ahead – US GDP and BoJ decision on top of next week’s agenda

Week ahead – US GDP and BoJ decision on top of next week’s agenda

US GDP, core PCE and PMIs the next tests for the Dollar. Investors await BoJ for guidance about next rate hike. EU and UK PMIs, as well as Australian CPIs also on tap.

Read more

Forex MAJORS

Cryptocurrencies

Signatures