|

GBP/USD Price Analysis: Remains inside falling wedge ahead of UK Inflation

  • GBP/USD is displaying a sideways auction as the focus has shifted to UK Inflation.
  • BoE Bailey reiterated that they must use the tool of interest rate rises carefully.
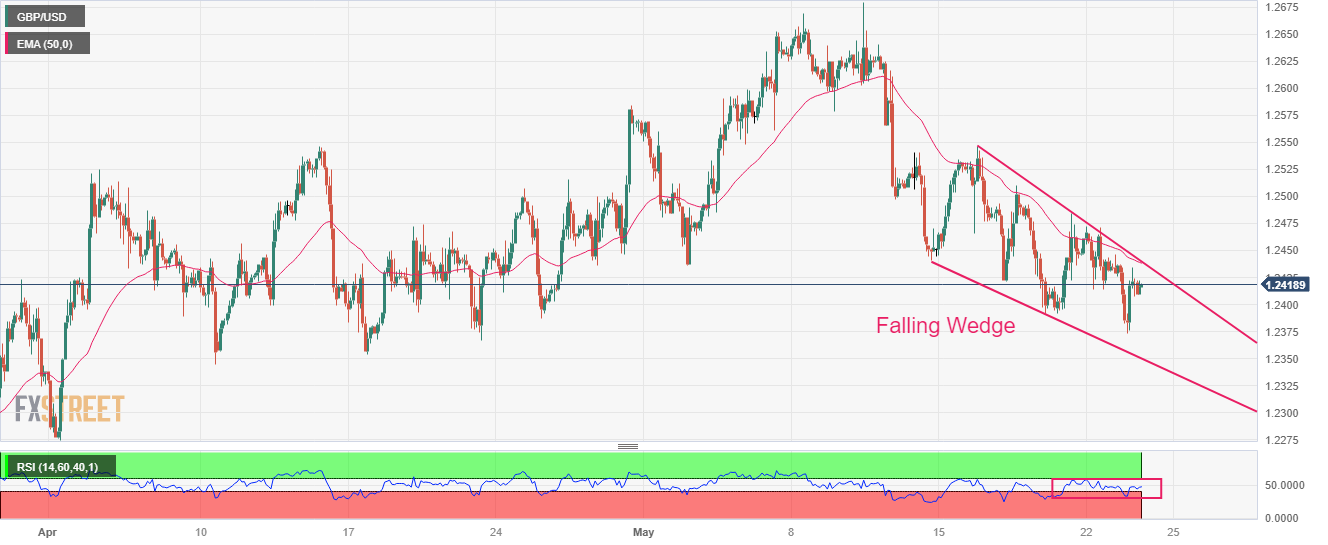
  • GBP/USD is auctioning in a Falling Wedge pattern in which each pullback is considered as a selling opportunity.

The GBP/USD pair is displaying a back-and-forth action around 1.2420 in the early Tokyo session. Earlier, the Cable showed significant recovery after defending the downside near 1.2380. A power-pack action is anticipated from the Pound Sterling ahead of the United Kingdom’s Consumer Price Index (CPI) data (April).

Headline inflation is seen softening sharply to 8.2% from the former release of 10.1%. The core CPI is expected to remain steady at 6.2%. On Tuesday, Bank of England (BoE) Governor Andrew Bailey said "I think we are nearer to the peak than we were” and reiterated that they must use the tool of interest rate rises carefully.

The US Dollar Index (DXY) is looking to surpass the crucial resistance of 103.62 amid US debt-ceiling issues. International Monetary Fund (IMF) Managing Director Kristalina Georgieva cited on Tuesday that "A lack of solution would have a detrimental impact on the US and world economy,” "Hopefully we won't have to wait to the 11th hour for a solution on the US debt-ceiling."

GBP/USD is auctioning in a Falling Wedge chart pattern on a two-hour scale in which each pullback is considered a selling opportunity by the market participants. Also, the chances of a bullish reversal remain higher. The 50-period Exponential Moving Average (EMA) at 1.2440 is acting as a barrier for the Pound Sterling bulls.

Meanwhile, a 40.00-60.00 range oscillation by the Relative Strength Index (RSI) (14) will get a decisive move after the release of the UK Inflation.

Should the asset decline below May 19 low at 1.2390, US Dollar bulls will get strengthened further and will drag the Cable toward April 10 low at 1.2344 followed by April 03 low at 1.2275.

On the flip side, a recovery move above May 09 high at 1.2640 will drive the major toward the round-level resistance at 1.2700 and 26 April 2022 high at 1.2772.

GBP/USD two-hour chart

GBP/USD

Overview
Today last price1.2419
Today Daily Change-0.0018
Today Daily Change %-0.14
Today daily open1.2437
 
Trends
Daily SMA201.2515
Daily SMA501.2416
Daily SMA1001.2274
Daily SMA2001.1971
 
Levels
Previous Daily High1.2472
Previous Daily Low1.2414
Previous Weekly High1.2547
Previous Weekly Low1.2392
Previous Monthly High1.2584
Previous Monthly Low1.2275
Daily Fibonacci 38.2%1.2436
Daily Fibonacci 61.8%1.245
Daily Pivot Point S11.241
Daily Pivot Point S21.2382
Daily Pivot Point S31.2351
Daily Pivot Point R11.2468
Daily Pivot Point R21.25
Daily Pivot Point R31.2527

Author

Sagar Dua

Sagar Dua

FXStreet

Sagar Dua is associated with the financial markets from his college days. Along with pursuing post-graduation in Commerce in 2014, he started his markets training with chart analysis.

More from Sagar Dua
Share:

Markets move fast. We move first.

Orange Juice Newsletter brings you expert driven insights - not headlines. Every day on your inbox.

By subscribing you agree to our Terms and conditions.

Editor's Picks

EUR/USD moves sideways below 1.1800 on Christmas Eve

EUR/USD struggles to find direction and trades in a narrow channel below 1.1800 after posting gains for two consecutive days. Bond and stock markets in the US will open at the usual time and close early on Christmas Eve, allowing the trading action to remain subdued. 

GBP/USD keeps range around 1.3500 amid quiet markets

GBP/USD keeps its range trade intact at around 1.3500 on Wednesday. The Pound Sterling holds the upper hand over the US Dollar amid pre-Christmas light trading as traders move to the sidelines heading into the holiday season. 

Gold retreats from record highs, trades below $4,500

Gold retreats after setting a new record-high above $4,520 earlier in the day and trades in a tight range below $4,500 as trading volumes thin out ahead of the Christmas break. The US Dollar selling bias remains unabated on the back of dovish Fed expectations, which continues to act as a tailwind for the bullion amid persistent geopolitical risks.

Bitcoin slips below $87,000 as ETF outflows intensify, whale participation declines

Bitcoin price continues to trade around $86,770 on Wednesday, after failing to break above the $90,000 resistance. US-listed spot ETFs record an outflow of $188.64 million on Tuesday, marking the fourth consecutive day of withdrawals.

Economic outlook 2026-2027 in advanced countries: Solidity test

After a year marked by global economic resilience and ending on a note of optimism, 2026 looks promising and could be a year of solid economic performance. In our baseline scenario, we expect most of the supportive factors at work in 2025 to continue to play a role in 2026.

Avalanche struggles near $12 as Grayscale files updated form for ETF

Avalanche trades close to $12 by press time on Wednesday, extending the nearly 2% drop from the previous day. Grayscale filed an updated form to convert its Avalanche-focused Trust into an ETF with the US Securities and Exchange Commission.