|

GBP/USD Price Analysis: Rejection from key resistance line highlights 1.2150 support confluence

  • GBP/USD remains sidelined after rising to the highest level in five months.
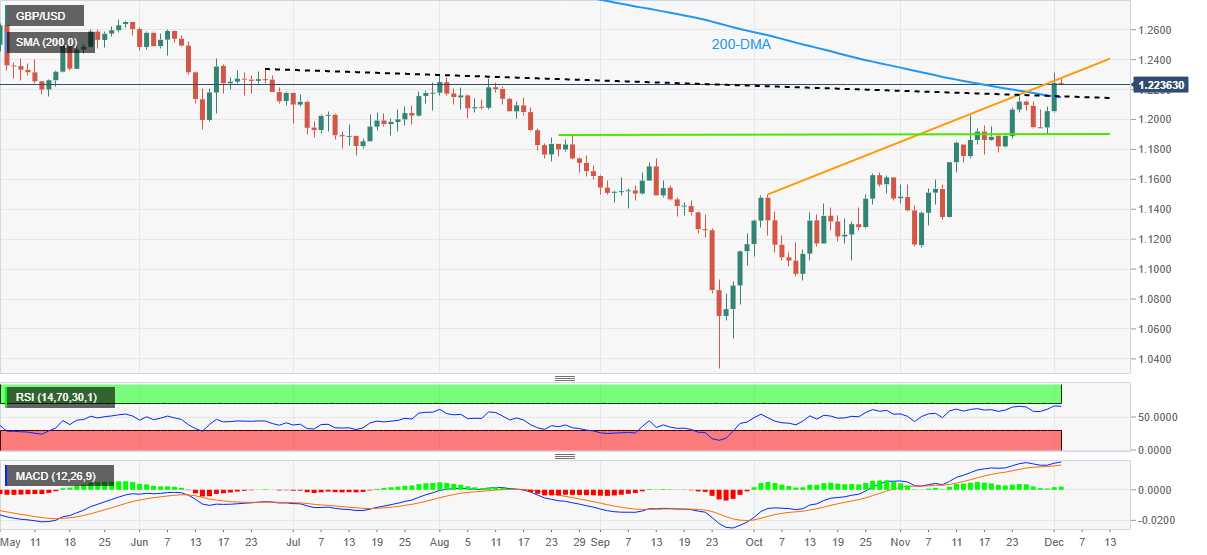
  • Overbought RSI, two-month-old resistance line challenge further upside.
  • Bear need validation from the convergence of 200-DMA, previous resistance line from late June.

GBP/USD treads water around mid-1.2200s after rising to the highest level since late June the previous day. In doing so the Cable pair portrays the market’s cautious mood ahead of the key US employment data while also justifying the price-negative technical signals.

Among them, overbought conditions of the Relative Strength Index (RSI) line, placed at 14, gain major attention as the quote struggles after a two-day uptrend that refreshed the multi-day peak.

Also challenging the GBP/USD bulls is the upward-sloping resistance line from early October, currently around 1.2280.

Just in case a wild move cracks the 1.2280 hurdle, the 1.2300 round figure and the mid-June high near 1.2410 could act as additional upside filters to watch during the quote’s further advances.

On the contrary, pullback remains elusive unless the GBP/USD pair remains beyond 1.2150 level comprising the 200-DMA and the resistance-turned-support line from late June.

Additionally, a convergence of the August month’s high and the weekly bottom also constitutes short-term key support near 1.1900 and may test the bears before giving them control.

Following that, tops marked in September and October, respectively near 1.1735 and 1.1645 will be in focus.

GBP/USD: Daily chart

Trend: Limited downside expected

Additional important levels

Overview
Today last price1.2242
Today Daily Change-0.0001
Today Daily Change %-0.01%
Today daily open1.2243
 
Trends
Daily SMA201.184
Daily SMA501.1475
Daily SMA1001.1651
Daily SMA2001.2155
 
Levels
Previous Daily High1.2311
Previous Daily Low1.2046
Previous Weekly High1.2154
Previous Weekly Low1.1779
Previous Monthly High1.2154
Previous Monthly Low1.1147
Daily Fibonacci 38.2%1.221
Daily Fibonacci 61.8%1.2147
Daily Pivot Point S11.2089
Daily Pivot Point S21.1935
Daily Pivot Point S31.1824
Daily Pivot Point R11.2354
Daily Pivot Point R21.2465
Daily Pivot Point R31.2619

Author

Anil Panchal

Anil Panchal

FXStreet

Anil Panchal has nearly 15 years of experience in tracking financial markets. With a keen interest in macroeconomics, Anil aptly tracks global news/updates and stays well-informed about the global financial moves and their implications.

More from Anil Panchal
Share:

Editor's Picks

EUR/USD weakens below 1.1900, USD remains firm

EUR/USD has slipped back into its downtrend, drifting below the 1.1900 support as the US Dollar’s recovery keeps gathering traction. Indeed, the Greenback’s push higher gathered pace after President Trump named Kevin Warsh as Jerome Powell’s successor and US Producer Prices rose more than expected in December.

GBP/USD retreats further, threatens 1.3700

Selling pressure remains on the rise, dragging GBP/USD back towards three-day lows around 1.3720-1.3710 at the end of the week. Cable’s retracement reflects a firmer rebound in the Greenback as investors digest Trump’s announcement of the next Fed chair.

Gold remains offered just above $5,000

Gold is extending its pullback, managing to trim part of its strong losses and regain the $5,000 mark and beyond on Friday. The precious metal’s severe drop comes amid broad-based profit-taking across the commodity space, alongside a firmer US Dollar and mixed US Treasury yields.

Stellar deepens correction, slipping to 3-month low as risk-off mood persists

Stellar continues to trade in the red, slipping below $0.20 on Friday, a level not seen since mid-October. Bearish sentiment intensifies amid falling Open Interest and negative funding rates in the derivatives market. On the technical side, weakening momentum indicators support further correction in XLM.

Microsoft sell-off etches $400 billion hole in market, second highest on record

Microsoft's (MSFT) post-earnings cratering on Thursday sent other indices into pullback mode despite the narrow nature of its weakness.

Top 3 Price Prediction: Bitcoin, Ethereum, Ripple deepen sell-off as bears take control of momentum

Bitcoin, Ethereum, and Ripple continued their corrections on Friday, posting weekly losses of nearly 6%, 3%, and 5%, respectively. BTC is nearing the November lows at $80,000, while ETH slips below $2,800 amid increasing downside pressure.