|

GBP/USD Price Analysis: Refreshes day high around 1.2330 as USD Index dives further, BoE policy eyed

  • GBP/USD has printed a fresh day's high at 1.2330 as the USD index has continued its downside journey.
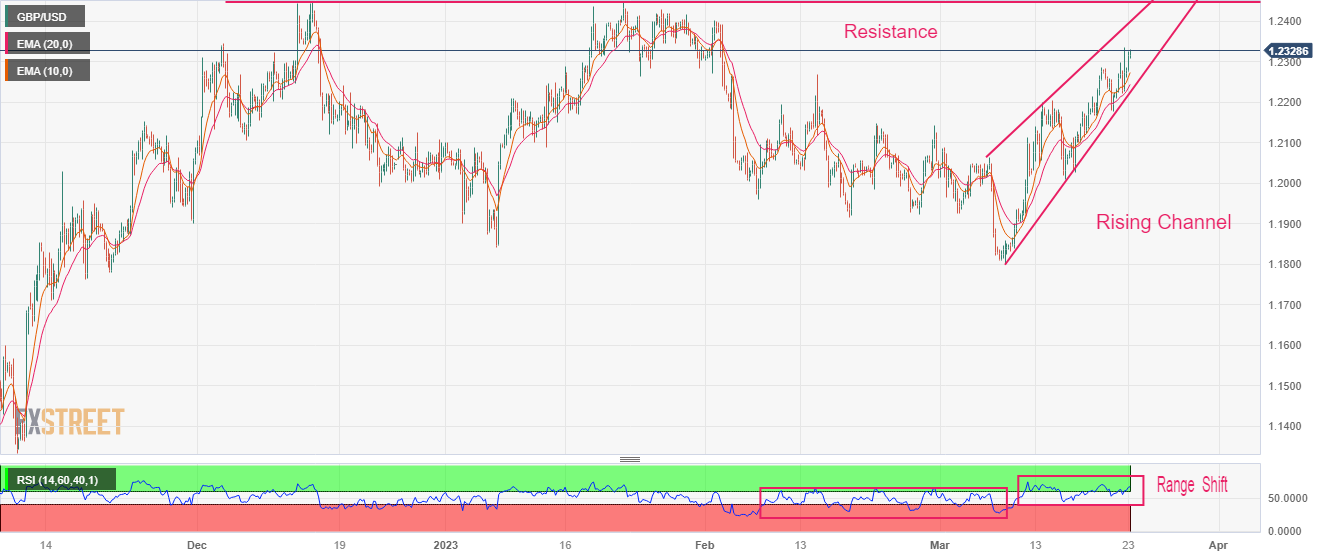
  • The cable is auctioning in a Rising Channel chart pattern in which every pullback is considered as a buying opportunity.
  • A range shift move by the RSI (14) into the bullish territory of 40.00-80.00 cement more upside ahead.

The GBP/USD pair has printed a fresh day high at 1.2330 in the early European session. The upside bias for Cable is backed by further weakness in the US Dollar Index (DXY) as the Federal Reserve (Fed) is approaching the phase of policy-tightening. Also, rising hawkish bets for Bank of England (BoE) policy after a surprise jump in the United Kingdom inflation is supporting the Pound Sterling.

Economists at Bank of America Global Research (BoA) are expecting a 25bp BoE rate hike, with dovish guidance.

The USD Index is struggling to sustain above 102.00 and is expected to extend its downside journey as the spotlight has shifted to risk-perceived assets. S&P500 futures have recovered firmly, indicating some revival in the risk appetite of the market participants.

GBP/USD is auctioning in a Rising Channel chart pattern on a four-hour scale in which every pullback is considered as a buying opportunity by the market participants. The Cable is marching towards the horizontal resistance plotted from December 13 high at 1.2444.

The 20-period Exponential Moving Average (EMA) at 1.2245 is providing cushion to the Pound Sterling bulls.

A range shift move by the Relative Strength into the bullish arena of 40.00-80.00 from the bearish region of 20.00-60.00 indicates more upside ahead.

The Cable has already shown a stellar rally, therefore, a mean-reversion move to near 10-period EMA 1.2275 would be an optimal opportunity for making fresh long. This will drive the asset toward December 05 high at 1.2345 followed by the horizontal resistance plotted from December 13 high at 1.2444.

On the flip side, a breakdown below March 21 low at 1.2212 would drag the Cable toward the round-level support around 1.2100 and March 15 low around 1.2000.

GBP/USD four-hour chart

GBP/USD

Overview
Today last price1.2329
Today Daily Change0.0064
Today Daily Change %0.52
Today daily open1.2265
 
Trends
Daily SMA201.2057
Daily SMA501.2146
Daily SMA1001.2073
Daily SMA2001.1894
 
Levels
Previous Daily High1.2336
Previous Daily Low1.2209
Previous Weekly High1.2204
Previous Weekly Low1.201
Previous Monthly High1.2402
Previous Monthly Low1.1915
Daily Fibonacci 38.2%1.2287
Daily Fibonacci 61.8%1.2257
Daily Pivot Point S11.2204
Daily Pivot Point S21.2143
Daily Pivot Point S31.2077
Daily Pivot Point R11.2331
Daily Pivot Point R21.2397
Daily Pivot Point R31.2458

Author

Sagar Dua

Sagar Dua

FXStreet

Sagar Dua is associated with the financial markets from his college days. Along with pursuing post-graduation in Commerce in 2014, he started his markets training with chart analysis.

More from Sagar Dua
Share:

Editor's Picks

EUR/USD slumps below 1.1750 as USD benefits from risk-aversion

EUR/USD comes under renewed bearish pressure in the European session and trades below 1.1750 following a recovery attempt earlier in the day. The US Dollar gathers strength and weighs on the pair as investors seek refuge in the wake of Israel and the United States' joint attack on Iran.

GBP/USD targets 1.3500 barrier near moving averages

GBP/USD rebounds from the daily losses, trading around 1.3450 during the Asian hours on Monday. The technical analysis of the daily chart indicates an ongoing bearish bias, as the pair trades within a descending channel pattern.

Gold surges on safe-haven demand, closes in on $5,400

Gold benefits from intense risk-aversion on Monday and climbs toward $5,400, setting a fresh monthly-high in the process. Tensions in the Middle East remain high as Israel and Hezbollah continue to exchange strikes following the US-Israel joint attack on Iran over the weekend.

Bitcoin, Ethereum and Ripple under pressure as key supports face breakdown risk

Bitcoin, Ethereum, and Ripple prices trade on the back foot at the start of this week on Monday, after extending losses in the previous week. BTC is on the brink of a breakdown, ETH is capped below key resistance, and XRP risks a crack of the trendline.

The market is paying for insurance, not apocalypse

As expected, this morning felt less like a Monday market open and more like a fire drill. Futures screens flickered red. S&P contracts down almost 1%. Nasdaq off 1.2%. Brent leaped 13% through $80. Gold rose 1.6% toward $5350 before paring some gains. The dollar is strutting mildly. The Swiss franc is quietly doing what it always does in a storm, catching some safe-haven flows.

Starknet unveils strkBTC, shielded Bitcoin transactions on Ethereum Layer 2

Starknet, the Ethereum Layer 2 network developed by StarkWare, today announced strkBTC, a wrapped Bitcoin asset that introduces optional shielding while preserving full DeFi composability.