GBP/USD Price Analysis: Recovery battles previous support below 1.2250
- GBP/USD grinds higher around intraday top, keeps bounce off two-year low.
- One-week-old previous support tests recovery moves amid bullish MACD signals.
- Steady RSI, short-term descending trend line challenge the rebound.
- May 2020 lows to lure bears during further downside.

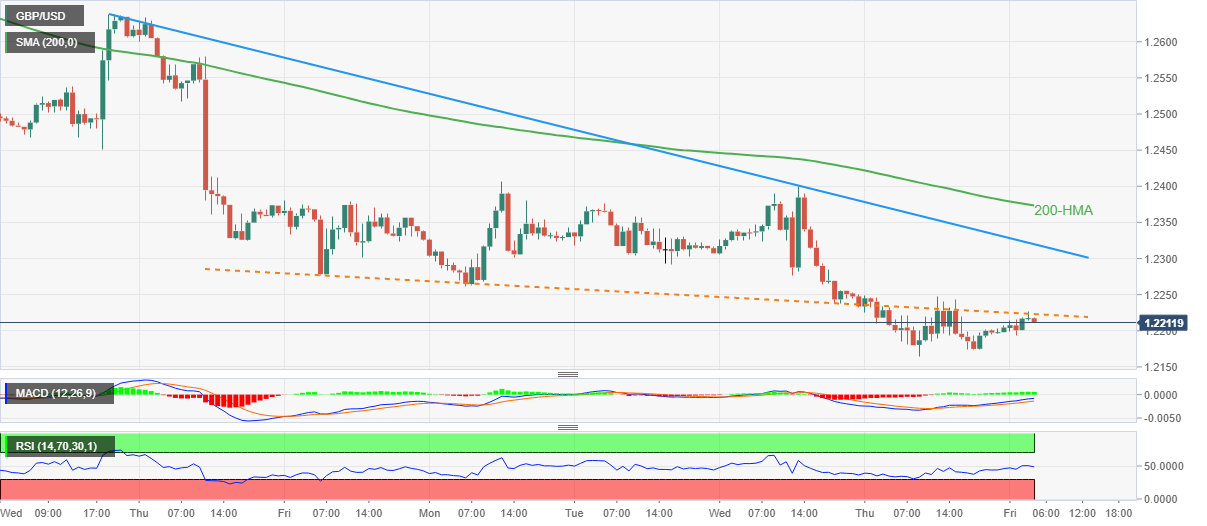
GBP/USD struggles to extend corrective pullback from multi-month low as a short-term resistance, previous support line, tests buyers around 1.2215 during early Friday morning in Europe.
Considering the recently bullish MACD signals, as well as the US dollar’s broad pullback, the cable pair’s latest rebound is likely to persist, unless any fundamental disappointments recall bears.
Even if the cable pair crosses the 1.2220 immediate hurdle, a downward sloping resistance line from May 04, near 1.2320, as well as the 200-HMA level of 1.2375, will challenge the GBP/USD buyers.
Alternatively, pullback moves may initially aim for the latest multi-month low near 1.2165 ahead of testing the 1.2100 round figure.
However, the GBP/USD pair’s weakness past 1.2100 will aim to the May 2020 bottom surrounding 1.2075 and the 2000 psychological magnet lure sellers.
GBP/USD: Hourly chart
Trend: Bearish
Author

Anil Panchal
FXStreet
Anil Panchal has nearly 15 years of experience in tracking financial markets. With a keen interest in macroeconomics, Anil aptly tracks global news/updates and stays well-informed about the global financial moves and their implications.


