|

GBP/USD Price Analysis: Ready to refresh multi-month high above 1.2500

  • GBP/USD seesaws near the highest levels since June 2022 during four-day uptrend.
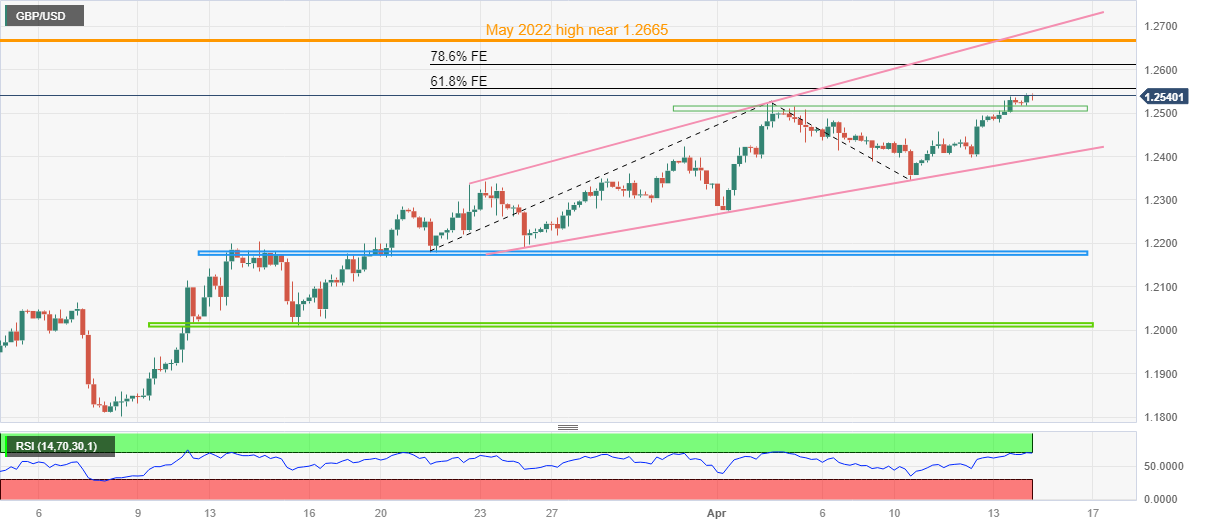
  • Clear upside break of eight-day-old horizontal resistance, now support, hints at further advances of the Cable pair.
  • Multiple key FE levels, mid-2022 peak can challenge buyer inside megaphone trend-widening pattern.

GBP/USD bulls take a breather at the highest levels in 10 months, making rounds to mid-1.2500s heading into Friday’s London open.

In doing so, the Cable pair bears the burden of the overbought RSI conditions while reassessing the odds of a further upside. However, a clear upside break of the previous key resistance comprising multiple levels marked since April 04, around 1.2510-2500, keeps the GBP/USD bulls hopeful of refreshing the multi-month top.

In that case, the 61.8% and 78.6% Fibonacci Expansion (FE) of the pair’s moves between March 21 and April 10, respectively near 1.2555 and 1.2615, could gain the market’s attention ahead of May 2022 high of around 1.2665.

It’s worth noting, however, that the top line of a three-week-old rising megaphone trend widening chart formation, around 1.2690 by the press time, can restrict the GBP/USD pair’s upside past 1.2665

Alternatively, pullback moves need to provide a convincing break below the 1.2500 round figure to recall the intraday sellers.

Even so, the aforementioned megaphone’s lower line, close to 1.2395 by the press time, can challenge the bears before giving them control.

Should the GBP/USD price remains bearish past 1.2395, multiple levels marked since early March constitute 1.2180-70 and 1.2015-05 as the key support to watch.

Overall, GBP/USD remains on the bull’s radar even if RSI conditions challenge the upside momentum of late.

GBP/USD: Four-hour chart

Trend: Gradual upside expected

Additional important levels

Overview
Today last price1.2541
Today Daily Change0.0019
Today Daily Change %0.15%
Today daily open1.2522
 
Trends
Daily SMA201.2358
Daily SMA501.2166
Daily SMA1001.2178
Daily SMA2001.1911
 
Levels
Previous Daily High1.2537
Previous Daily Low1.2478
Previous Weekly High1.2525
Previous Weekly Low1.2275
Previous Monthly High1.2424
Previous Monthly Low1.1803
Daily Fibonacci 38.2%1.2515
Daily Fibonacci 61.8%1.2501
Daily Pivot Point S11.2488
Daily Pivot Point S21.2453
Daily Pivot Point S31.2429
Daily Pivot Point R11.2547
Daily Pivot Point R21.2572
Daily Pivot Point R31.2606

Author

Anil Panchal

Anil Panchal

FXStreet

Anil Panchal has nearly 15 years of experience in tracking financial markets. With a keen interest in macroeconomics, Anil aptly tracks global news/updates and stays well-informed about the global financial moves and their implications.

More from Anil Panchal
Share:

Editor's Picks

AUD/USD falls to near 0.7100 after slipping below 50-day EMA

AUD/USD depreciates after registering minor gains in the previous day, trading around 0.7120 during the Asian hours. The technical analysis of the daily chart shows the pair consolidating sideways within a rectangle pattern, as neither bulls nor bears gain control. The AUD/USD pair is holding a slight bearish tone however as it sits beneath both the nine-day and 50-day EMAs.

160.00: USD/JPY back near intervention territory after upbeat US jobs report

US Nonfarm Payrolls beat expectations by a wide margin in May, with 172K jobs added. The US Dollar rebounds after the release, helping USD/JPY recover from its intraday lows. Warnings from Japanese authorities continue to limit upside potential near the 160.00 threshold.

Gold targets $4,300 amid stronger Dollar

Gold faces increasing selling interest and navigates the area of three-month lows near the $4,300 mark per troy ounce on Friday. The precious metal’s decline comes as traders assess the stronger-than-expected NFP, while the bid bias in the Greenback and higher US Treasury yields also collaborate with the retracement.

Cardano hits five-year low even as Hoskinson clarifies "break" isn't an exit

Cardano (ADA) price is down 10% at press time on Friday, extending losses over 30% so far this week amid Charles Hoskinson's clarification that "break" isn't an exit.

Week ahead – Fed countdown begins amid US inflation data and geopolitical risks

Fed Chair Warsh’s first meeting approaches as key US inflation data could reshape expectations. Oil prices remain elevated as US-Iran talks continue; tariffs also return to the spotlight. ECB is expected to hike; will it be a one-off move or is July live?

The US economy defies the rules: 100 days into the Oil shock and the recession signal is still missing

More than three months after the start of the Iran war and the resulting disruption to global energy markets, the US economy continues to display remarkable resilience. The conflict has triggered a sharp rise in Oil prices, reignited inflationary pressures and fueled widespread concerns about a potential economic slowdown.